Q: 1
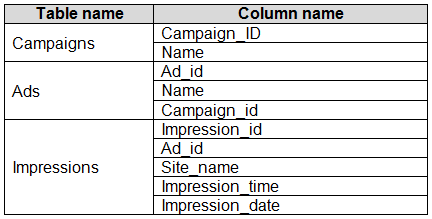
You have the tables shown in the following table.
 The Impressions table contains approximately 30 million records per month.
You need to create an ad analytics system to meet the following requirements:
Present ad impression counts for the day, campaign, and Site_name. The analytics for the last year
are required.
Minimize the data model size.
Which two actions should you perform? Each correct answer presents part of the solution.
NOTE: Each correct selection is worth one point.
The Impressions table contains approximately 30 million records per month.
You need to create an ad analytics system to meet the following requirements:
Present ad impression counts for the day, campaign, and Site_name. The analytics for the last year
are required.
Minimize the data model size.
Which two actions should you perform? Each correct answer presents part of the solution.
NOTE: Each correct selection is worth one point.
 The Impressions table contains approximately 30 million records per month.
You need to create an ad analytics system to meet the following requirements:
Present ad impression counts for the day, campaign, and Site_name. The analytics for the last year
are required.
Minimize the data model size.
Which two actions should you perform? Each correct answer presents part of the solution.
NOTE: Each correct selection is worth one point.
The Impressions table contains approximately 30 million records per month.
You need to create an ad analytics system to meet the following requirements:
Present ad impression counts for the day, campaign, and Site_name. The analytics for the last year
are required.
Minimize the data model size.
Which two actions should you perform? Each correct answer presents part of the solution.
NOTE: Each correct selection is worth one point.Options
Discussion
No comments yet. Be the first to comment.
Be respectful. No spam.
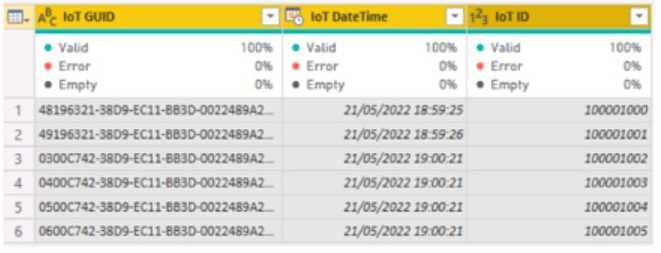 The IOT ID columns are unique to each row in query.
You need to analyze 10T events by the hour and day of the year. The solution must improve dataset
performance.
Solution: You change the IOT DateTime column to the Date data type.
Does this meet the goal?
The IOT ID columns are unique to each row in query.
You need to analyze 10T events by the hour and day of the year. The solution must improve dataset
performance.
Solution: You change the IOT DateTime column to the Date data type.
Does this meet the goal?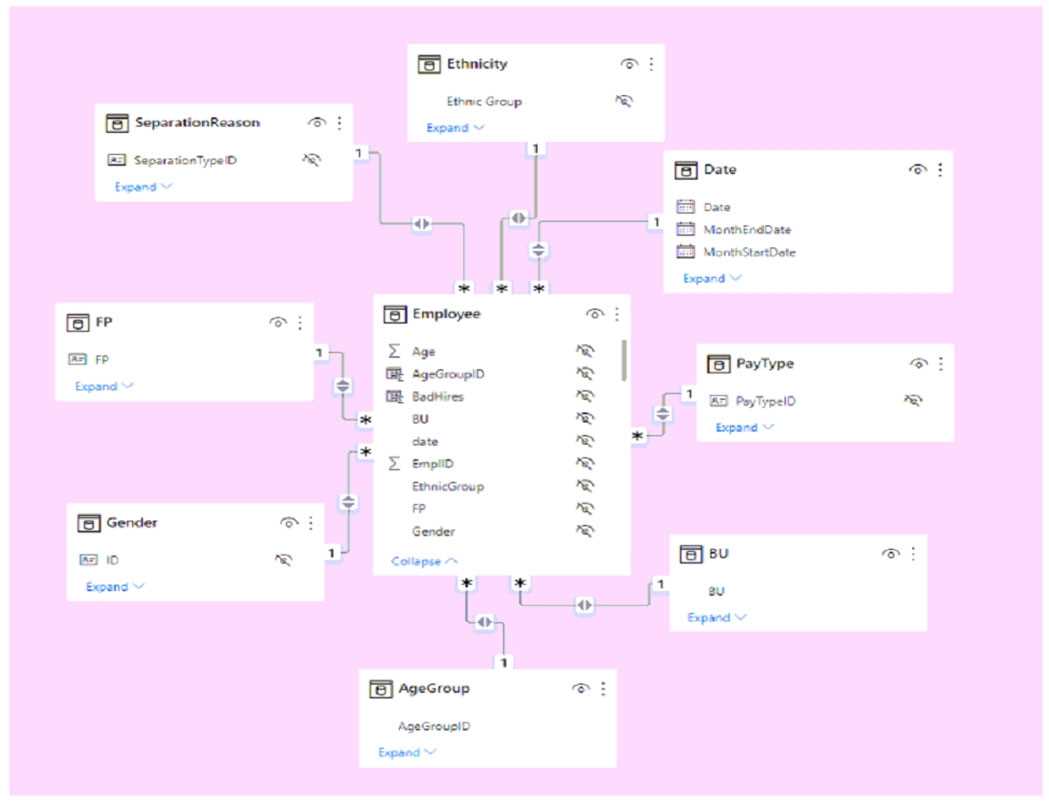 Use the drop-down menus to select the answer choice that completes each statement based on the information presented in the graphic. NOTE: Each correct selection is worth one point.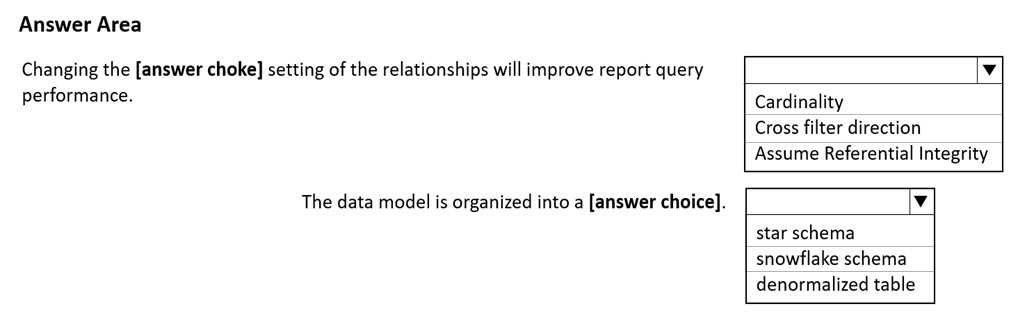
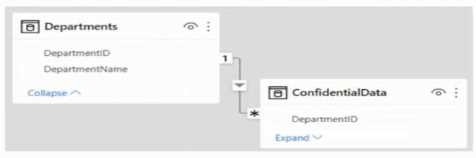 There are four departments in the Departments table.
You need to ensure that users can see the data of their respective department only.
What should you do?
There are four departments in the Departments table.
You need to ensure that users can see the data of their respective department only.
What should you do?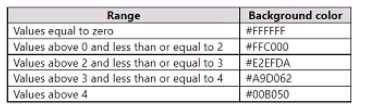 Which three actions should you perform in sequence in Power B) Desktop? To answer, move the appropriate actions from the list of actions to the answer area and arrange them in the correct order.
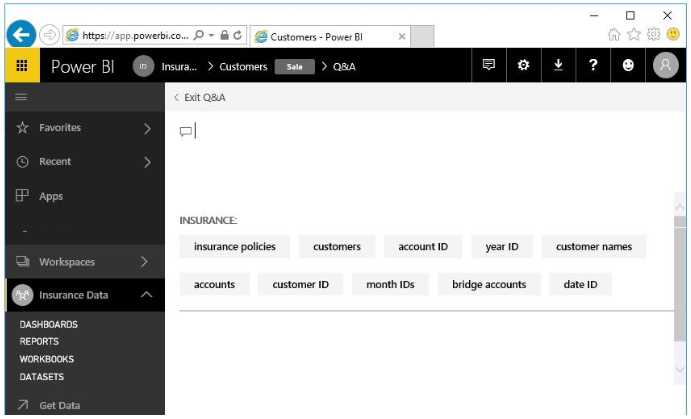 Use the drop-down menus to select the answer choice that completes each statement based on the information presented in the graphic. NOTE: Each correct selection is worth one point.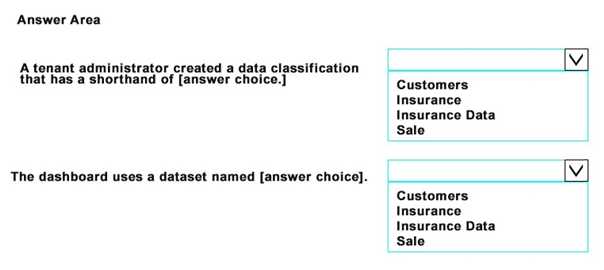
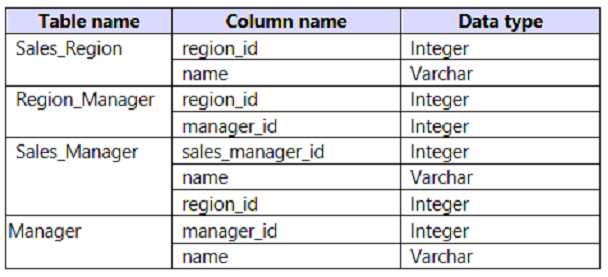 The model has the following relationships: *There is a one-to-one relationship between Sales_Region and Region_Manager. *There are more records in Manager than in Region_Manager, but every record in Region_Manager has a corresponding record in Manager. *There are more records in Sales_Manager than in Sales_Region, but every record in Sales_Region has a corresponding record in Sales_Manager. You need to denormalize the model into a single table. Only managers who are associated to a sales region must be included in the reports. Which three actions should you perform in sequence? To answer, move the appropriate actions from the list of actions to the answer area and arrange them in the correct order. NOTE: More than one order of answer choices is correct. You will receive credit for any of the correct orders you select.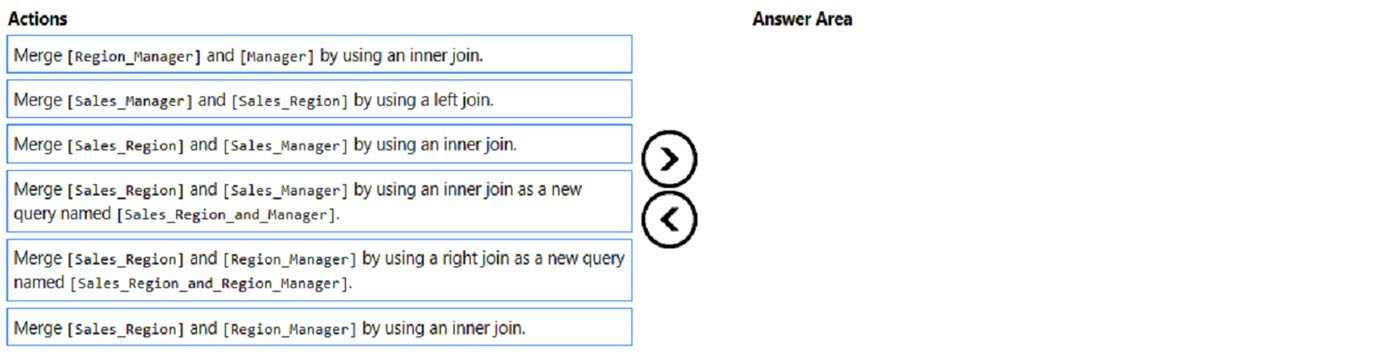
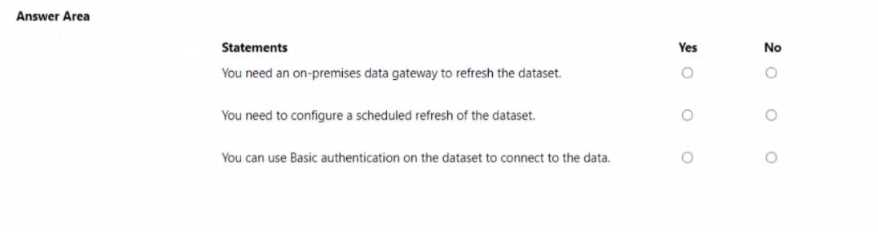
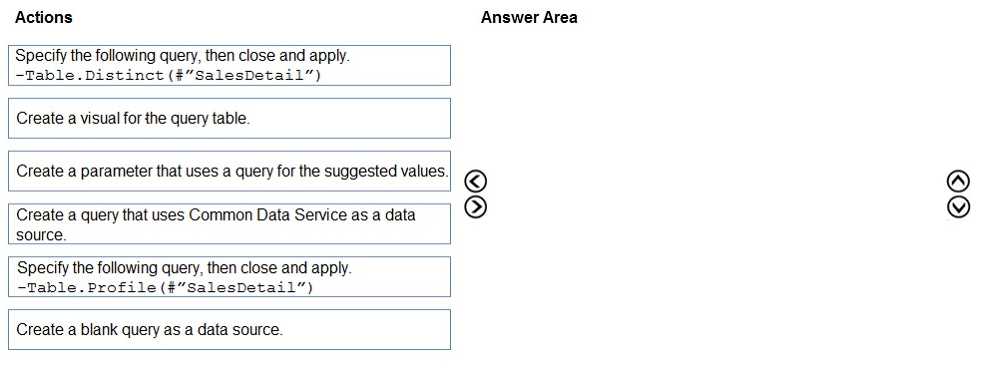
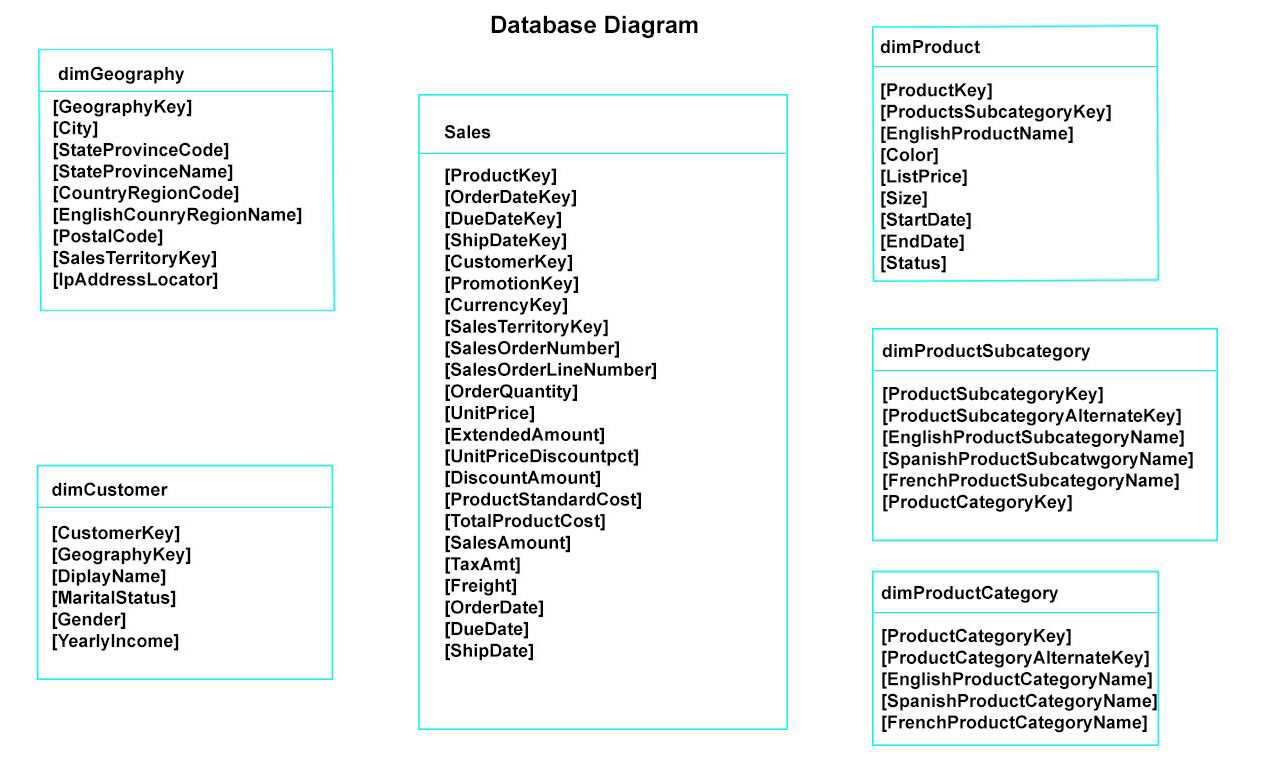 You plan to develop a Power BI model as shown in the Power BI Model exhibit. (Click the Exhibit).
 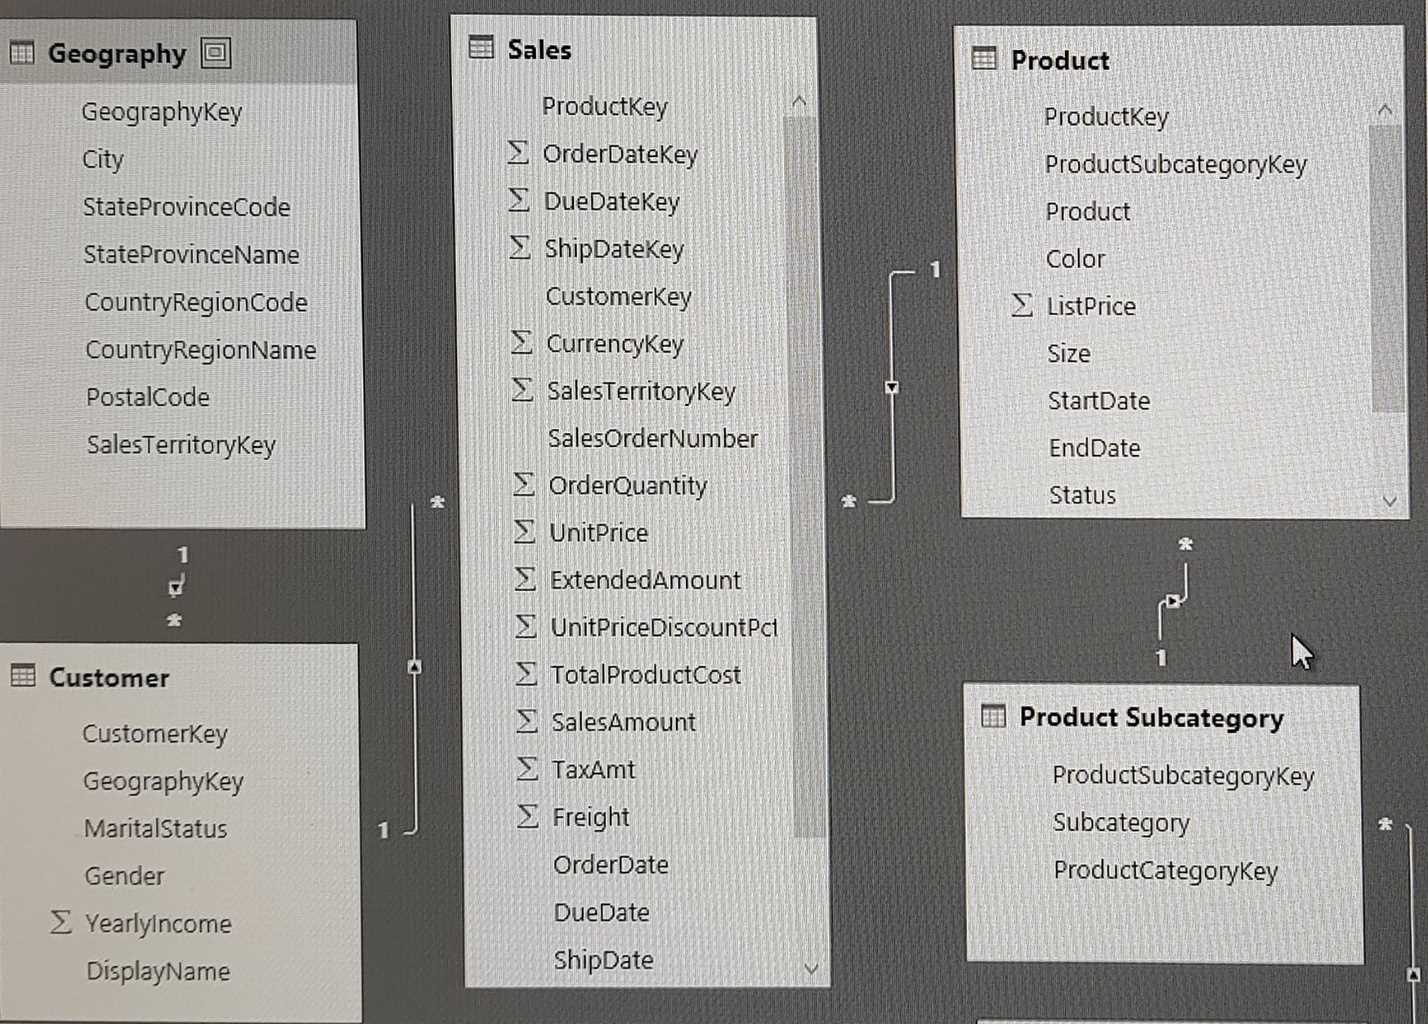 You plan to use Power BI to import data from 2013 to 2015. Product Subcategory [Subcategory] contains NULL values. End of repeated scenario. You implement the Power BI model. You need to edit the Product Category table query to match the desired Power BI model. How should you complete the advanced query? To answer, drag the appropriate values to the correct targets. Each value may be used once, more than once, or not at all. You may need to frag the split bar between panes or scroll to view content. NOTE: Each correct selection is worth one point.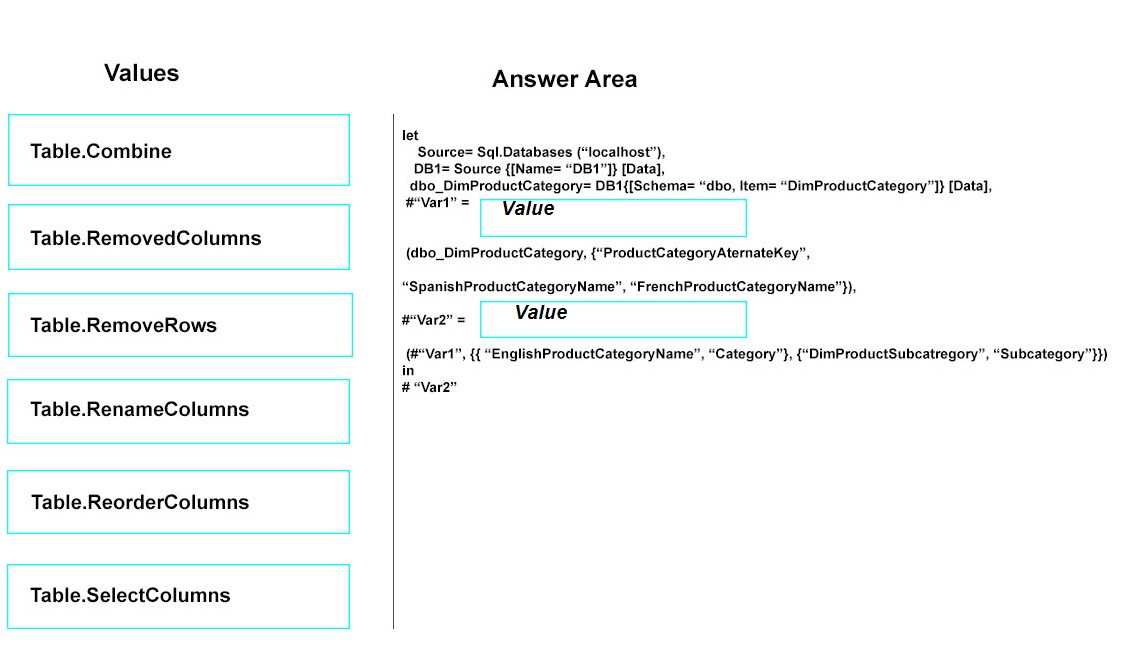
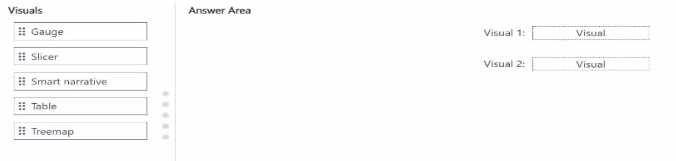
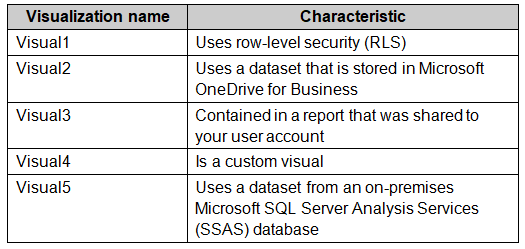 Which two visualizations can you embed into the website? Each correct answer presents a complete
the solution.
NOTE: Each correct selection is worth one point.
Which two visualizations can you embed into the website? Each correct answer presents a complete
the solution.
NOTE: Each correct selection is worth one point. The model contains one measure that has the following formula. Deliveries = COUNTROWS('fact Deliveries')