
Q: 5
HOTSPOT
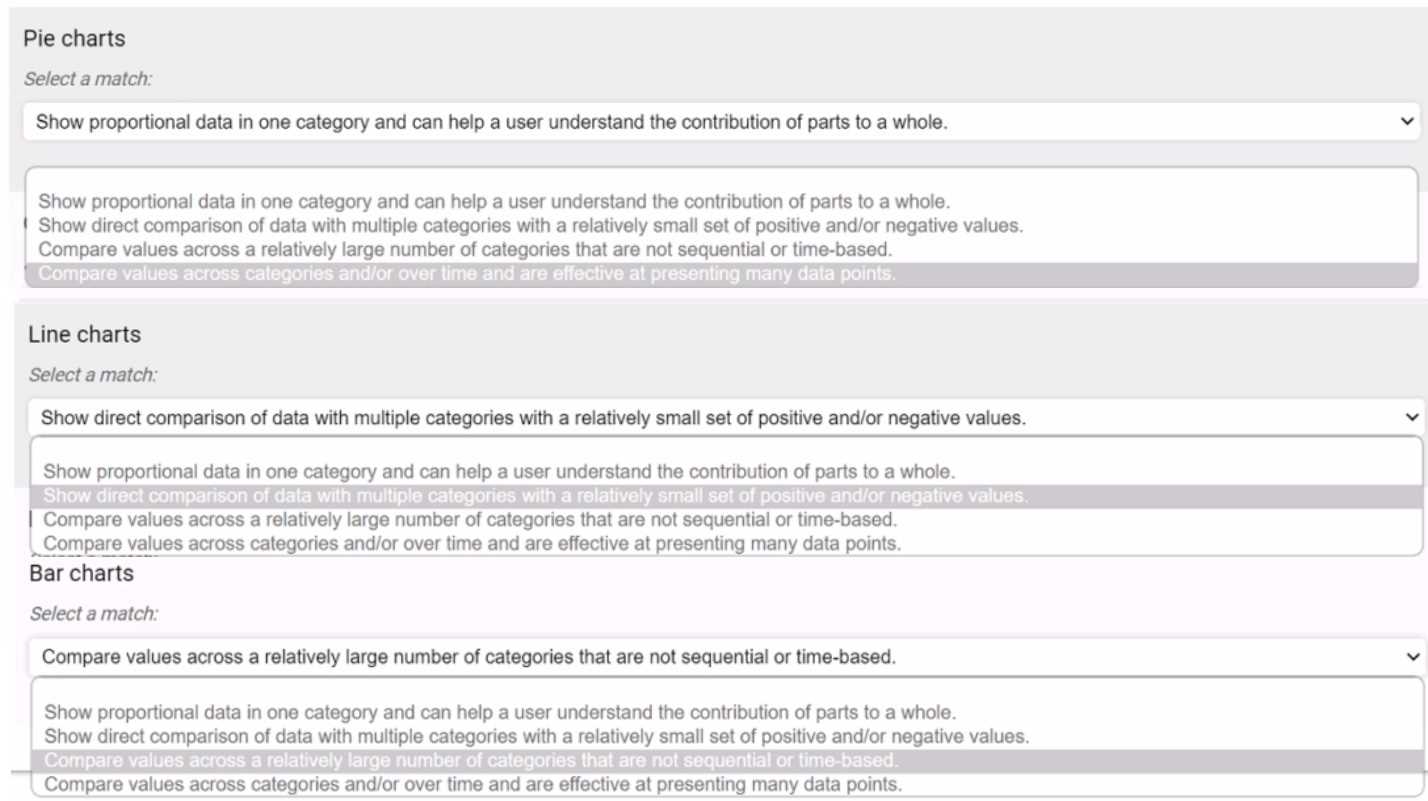
You are presenting data through data visualization.
Match the chart types to the data they are best suited to represent. Each answer will be used once.
Note: To change your responses, you may deselect your response by clicking the blank space at the
top of the selection list.

Your Answer
Discussion
No comments yet. Be the first to comment.
Be respectful. No spam.
