part of
the Complete
Solution and step by
step instructions.
Explanation:
To troubleshoot the NSX IPSec VPN service that has been reported down, you need to follow these
steps:
Log in to the NSX Manager UI with admin credentials. The default URL is https://.
Navigate to Networking > VPN > IPSec VPN and select the IPSec VPN session that is down. You can
identify the session by its name, local endpoint, remote endpoint, and status.
Click Show IPSec Statistics and view the details of the IPSec VPN session failure. You can see the error
message, the tunnel state, the IKE and ESP status, and the statistics of the traffic sent and received.
Compare the configuration details of the IPSec VPN session with the expected configuration as
provided below. Check for any discrepancies or errors in the parameters such as local and remote
endpoints, local and remote networks, IKE and ESP profiles, etc.
If you find any configuration errors, click Actions > Edit and modify the parameters accordingly. Click
Save to apply the changes.
If you do not find any configuration errors, check the connectivity and firewall rules between the
local and remote endpoints. You can use ping or traceroute commands from the NSX Edge CLI to test
the connectivity. You can also use show service ipsec command to check the status of IPSec VPN
service on the NSX Edge.
If you find any connectivity or firewall issues, resolve them by adjusting the network settings or
firewall rules on the NSX Edge or the third-party device.
After resolving the issues, verify that the IPSec VPN session is up and running by refreshing the IPSec
VPN page on the NSX Manager UI. You can also use show service ipsec sp and show service ipsec sa
commands on the NSX Edge CLI to check the status of security policy and security association for the
IPSec VPN session.

 Complete the requested task.
Notes: Passwords are contained in the user_readme.txt. This task is not dependent on another. This
task Should take approximately 15 minutes to complete.
Complete the requested task.
Notes: Passwords are contained in the user_readme.txt. This task is not dependent on another. This
task Should take approximately 15 minutes to complete.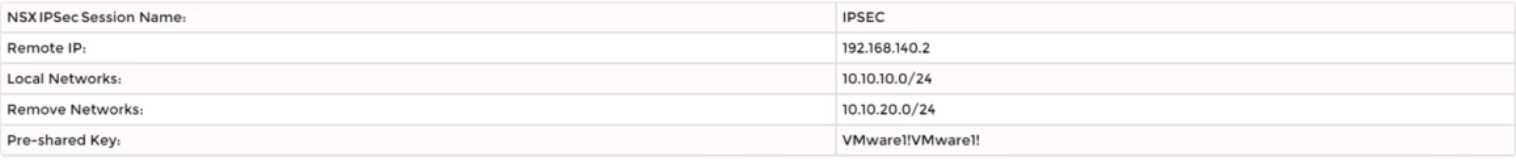 Complete the requested task.
Notes: Passwords are contained in the user_readme.txt. This task is not dependent on another. This
task Should take approximately 15 minutes to complete.
Complete the requested task.
Notes: Passwords are contained in the user_readme.txt. This task is not dependent on another. This
task Should take approximately 15 minutes to complete.