Q: 1
An advertiser is running an A/B test on Facebook with the goal of finding whether creative strategy A
or B achieves the most conversions. What is the null hypothesis of this test design?
Options
Discussion
Its C. Facebook's exam loves to use literal zeros for the null, even though classic stats would say equal rates (A). Seen this on a few practice questions. Bit weird, but that’s just how they write it here I think. If anyone sees different wording let me know.
Technically, I'd pick A here. The null usually tests for no difference (Conversions A = Conversions B), not both being zero. Unless the question meant a totally inactive campaign, it's a subtle trap. Anyone have a different read?
C or A. Usually null means equal conversions (A) in stats, but Facebook sometimes wants literal zero (C).
My vote is C here. Facebook exam loves using literal zero conversions for the null, even though in real stats it's usually equal rates (A). Looks odd but that's the style they use in practice sets. A is the trap if you're thinking classic hypothesis testing.
My vote is A. Isn't the null normally that both groups perform equally? C feels more like a trick answer here.
This is straight from recent practice sets, pretty sure it's C. Phrasing is weird but Facebook goes with literal zero conversions as the null. If you want more on this, the official guide explains test setup too.
C tbh
A or D, honestly. Classic stats says the null should be "no difference between A and B" so that's A, but D might fit if you read the symbol as 'any difference' in conversions. I could see C thrown out if they wanted literal zero only.
Isn't the null hypothesis usually that there's no difference between groups, so A? Unless they're testing for zero conversions specifically, C feels odd here. Anyone else run into this phrasing on practice exams?
C/D? This one feels off, null should be A but not sure with these choices.
Be respectful. No spam.
 Which conclusion should the analyst make based on this data?
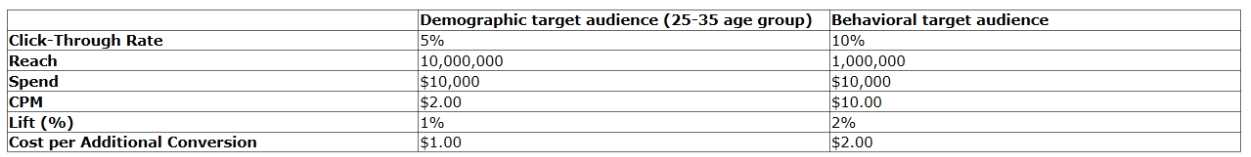
 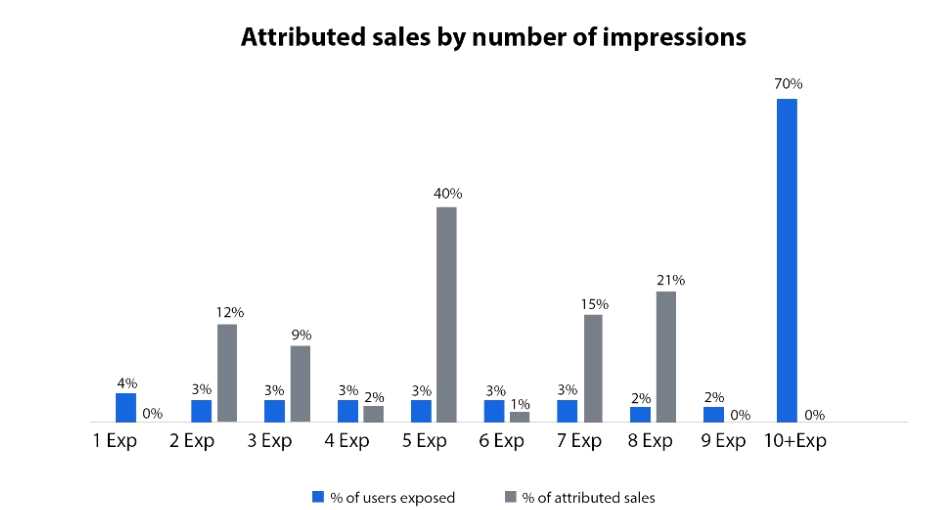 What should the company test using experimental design to improve efficiency in number of
exposures?
What should the company test using experimental design to improve efficiency in number of
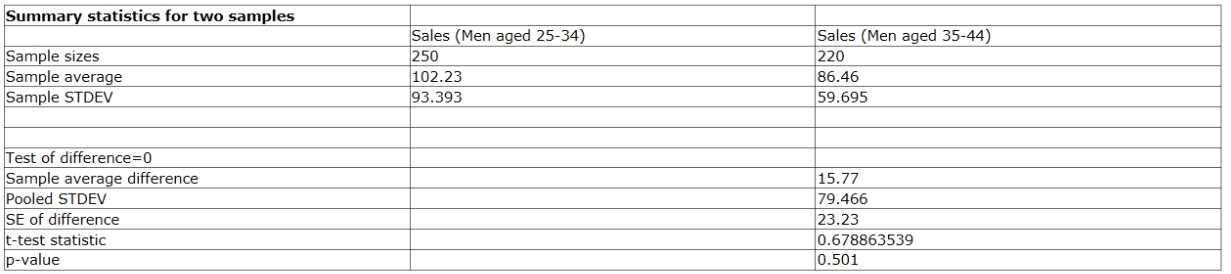
exposures? What interpretation should be made from the output?
 How many of these data points are likely to skew the findings of this analysis?