
Free APPLIED-ALGEBRA Practice Test Questions and Answers (2026)
Q: 1
As sacks are unloaded off a wagon, the total weight of the wagon and sacks changes. Each sack has
the same weight. After 3 sacks are removed, the total weight of the cart and remaining sacks is 116
pounds. After 6 sacks are removed, the total weight is 101 pounds.
What is the weight of each sack?
Options
Discussion
No comments yet. Be the first to comment.
Be respectful. No spam.
Q: 2
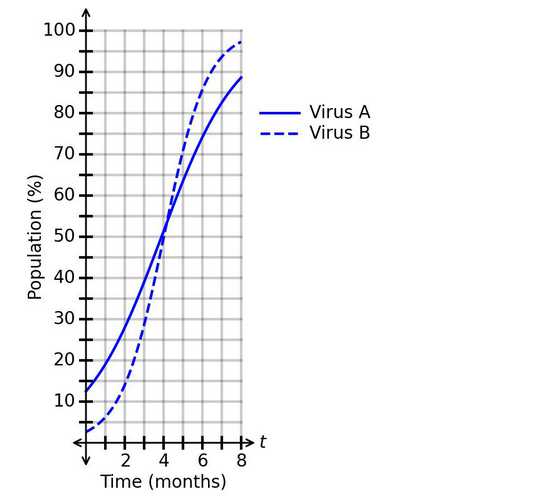
The spread of two viruses within a single population is modeled using the functions in the graph.
What is a correct conclusion based on the graph?
What is a correct conclusion based on the graph?Options
Discussion
No comments yet. Be the first to comment.
Be respectful. No spam.
Q: 3
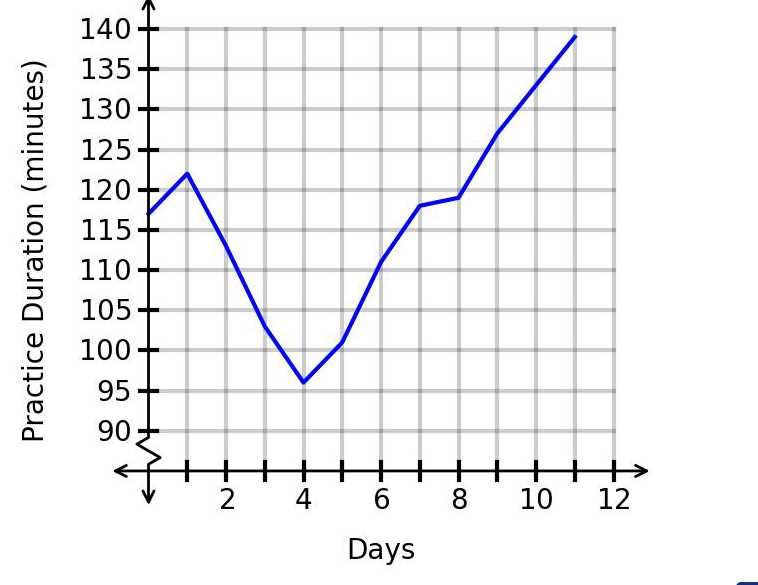
The graph shows the daily practice duration for a musician, where the number of days since the
beginning of the month is along the horizontal axis and the number of minutes practiced per day is
along the vertical axis.
What was the practice duration for day 9, based on the graph?
What was the practice duration for day 9, based on the graph?Options
Discussion
No comments yet. Be the first to comment.
Be respectful. No spam.
Q: 4
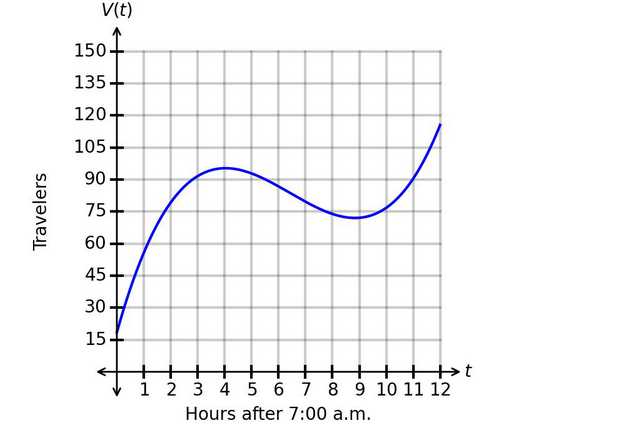
The function represents the number of travelers, , in a travel depot hours after 7:00 a.m. The graph
of is shown.
What does represent?
What does represent?Options
Discussion
No comments yet. Be the first to comment.
Be respectful. No spam.
Q: 5
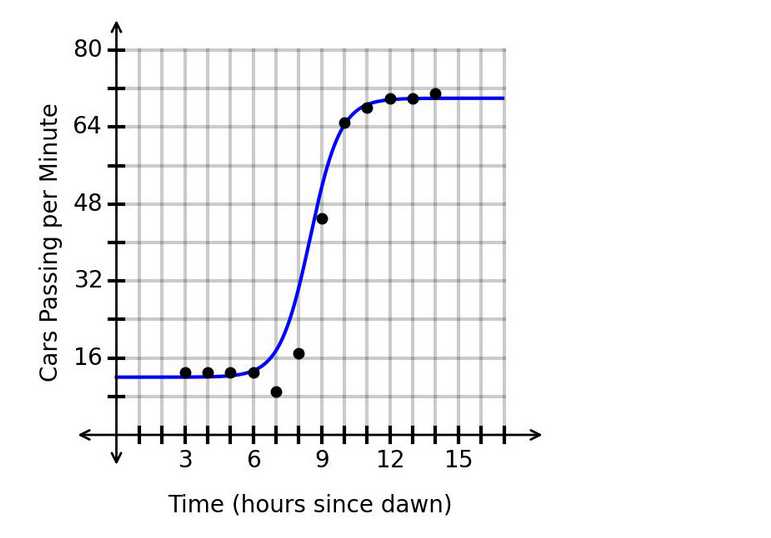
A researcher collected data on the traffic frequency on a section of road. The results are shown in the
scatterplot. A regression function is graphed with . The predicted traffic frequency 16.2 hours after
dawn is 70 cars per minute.
Is this prediction appropriate?
Is this prediction appropriate?Options
Discussion
No comments yet. Be the first to comment.
Be respectful. No spam.
Q: 6
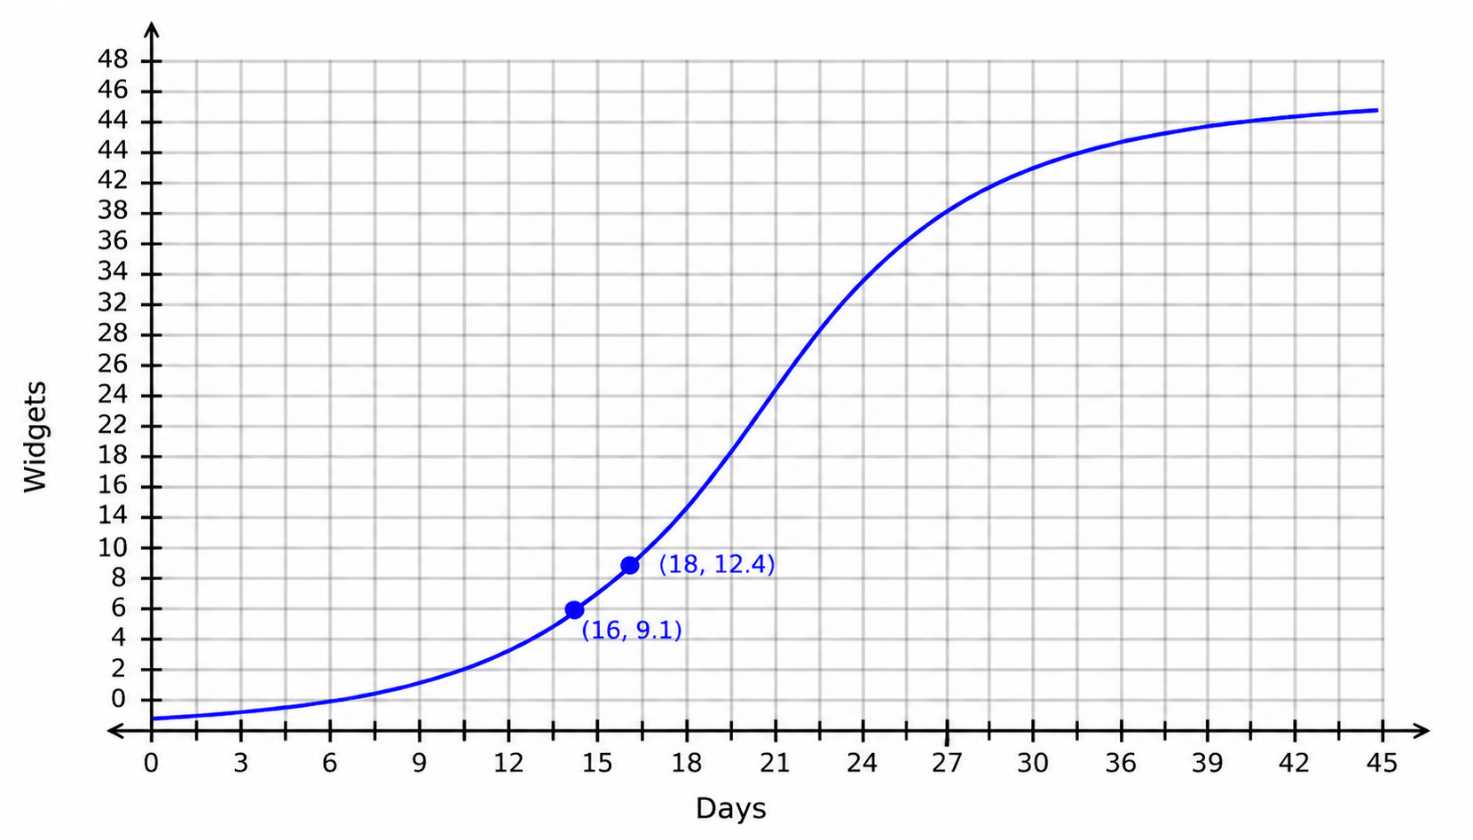
The graph shows the progress of a manufacturing team, modeling the number of widgets the team is
able to produce each day since the team was formed.
How should the average rate of change from day 16 to day 18 be interpreted?
How should the average rate of change from day 16 to day 18 be interpreted?Options
Discussion
No comments yet. Be the first to comment.
Be respectful. No spam.
Q: 7
A contractor charges a flat rate plus a fixed rate per hour to come and make repairs. For a job that
takes 3 hours, the contractor charges . For a job that takes 5 hours, the contractor charges .
Which function correctly represents the total charge Cfor a job that takes thours?
Options
Discussion
No comments yet. Be the first to comment.
Be respectful. No spam.
Q: 8
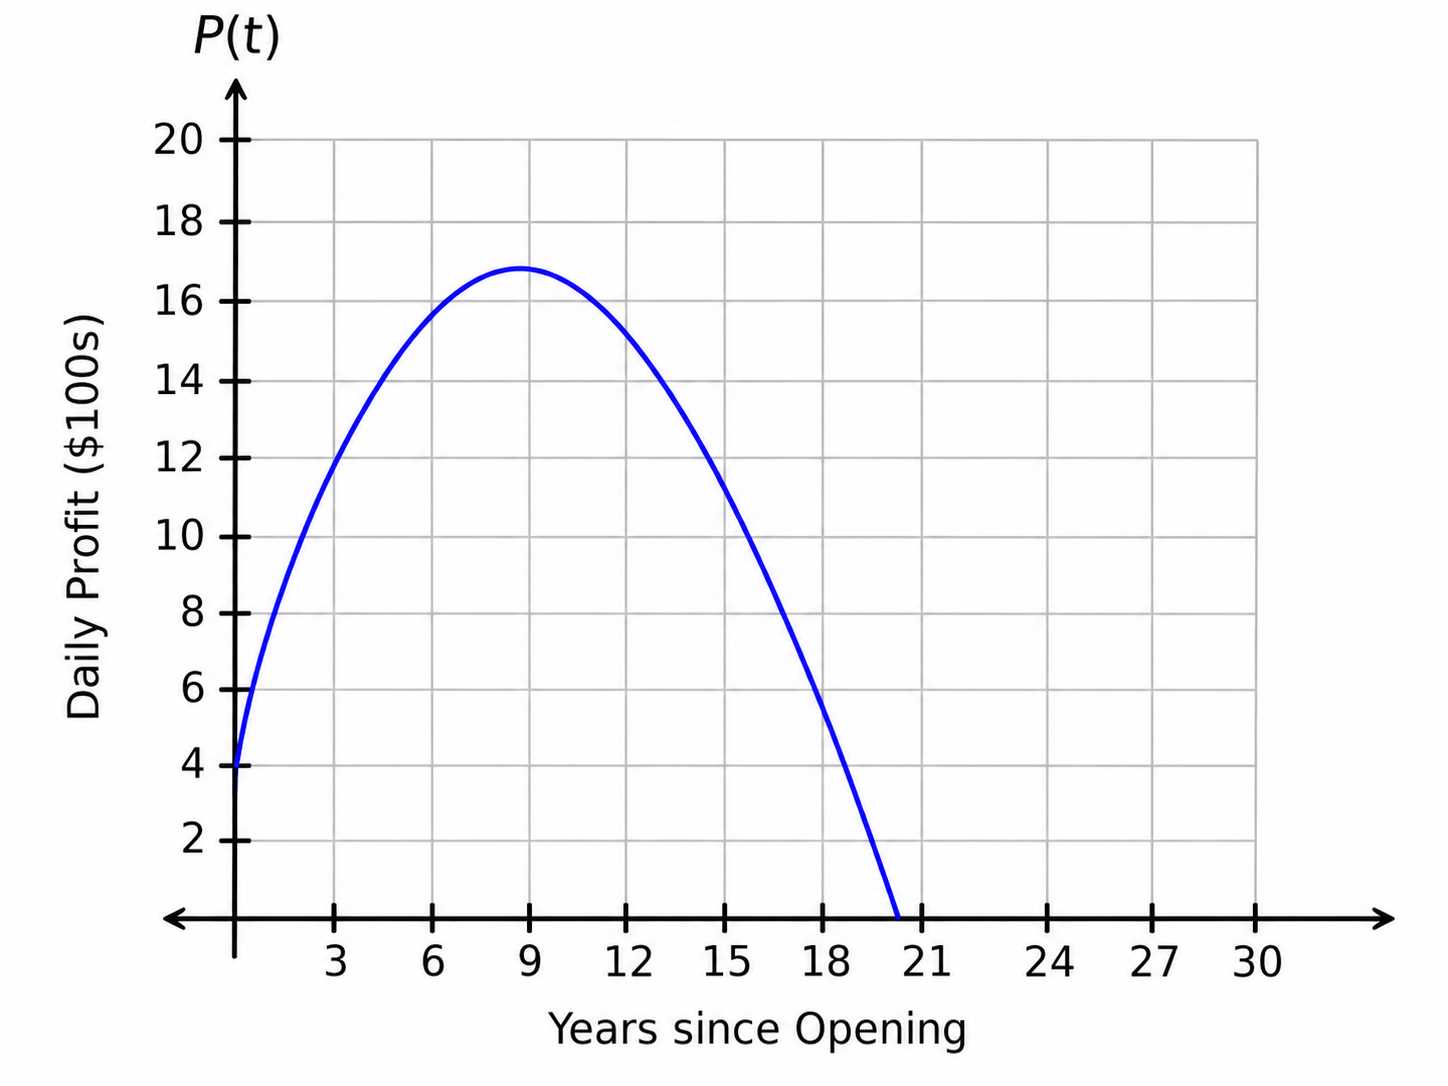
The function represents the daily profit, in hundreds of dollars, for a museum since opening. The
graph of is shown.
What is the correct interpretation of the maximum value?
What is the correct interpretation of the maximum value?Options
Discussion
No comments yet. Be the first to comment.
Be respectful. No spam.
Q: 9
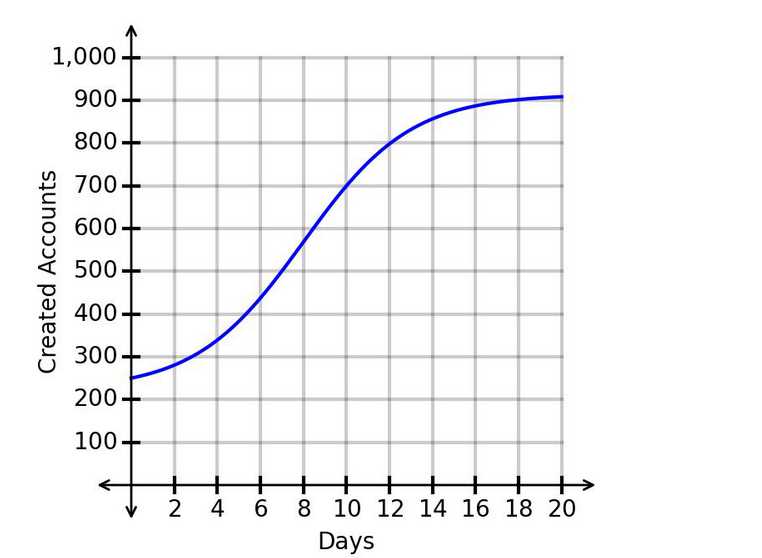
The logistic function , whose graph is shown, models the number of people who have created a
website account, where represents the number of days since the website started and represents the
number of people who have created an account.
What is one range of values for which the graph is concave down?
What is one range of values for which the graph is concave down?Options
Discussion
No comments yet. Be the first to comment.
Be respectful. No spam.
Q: 10
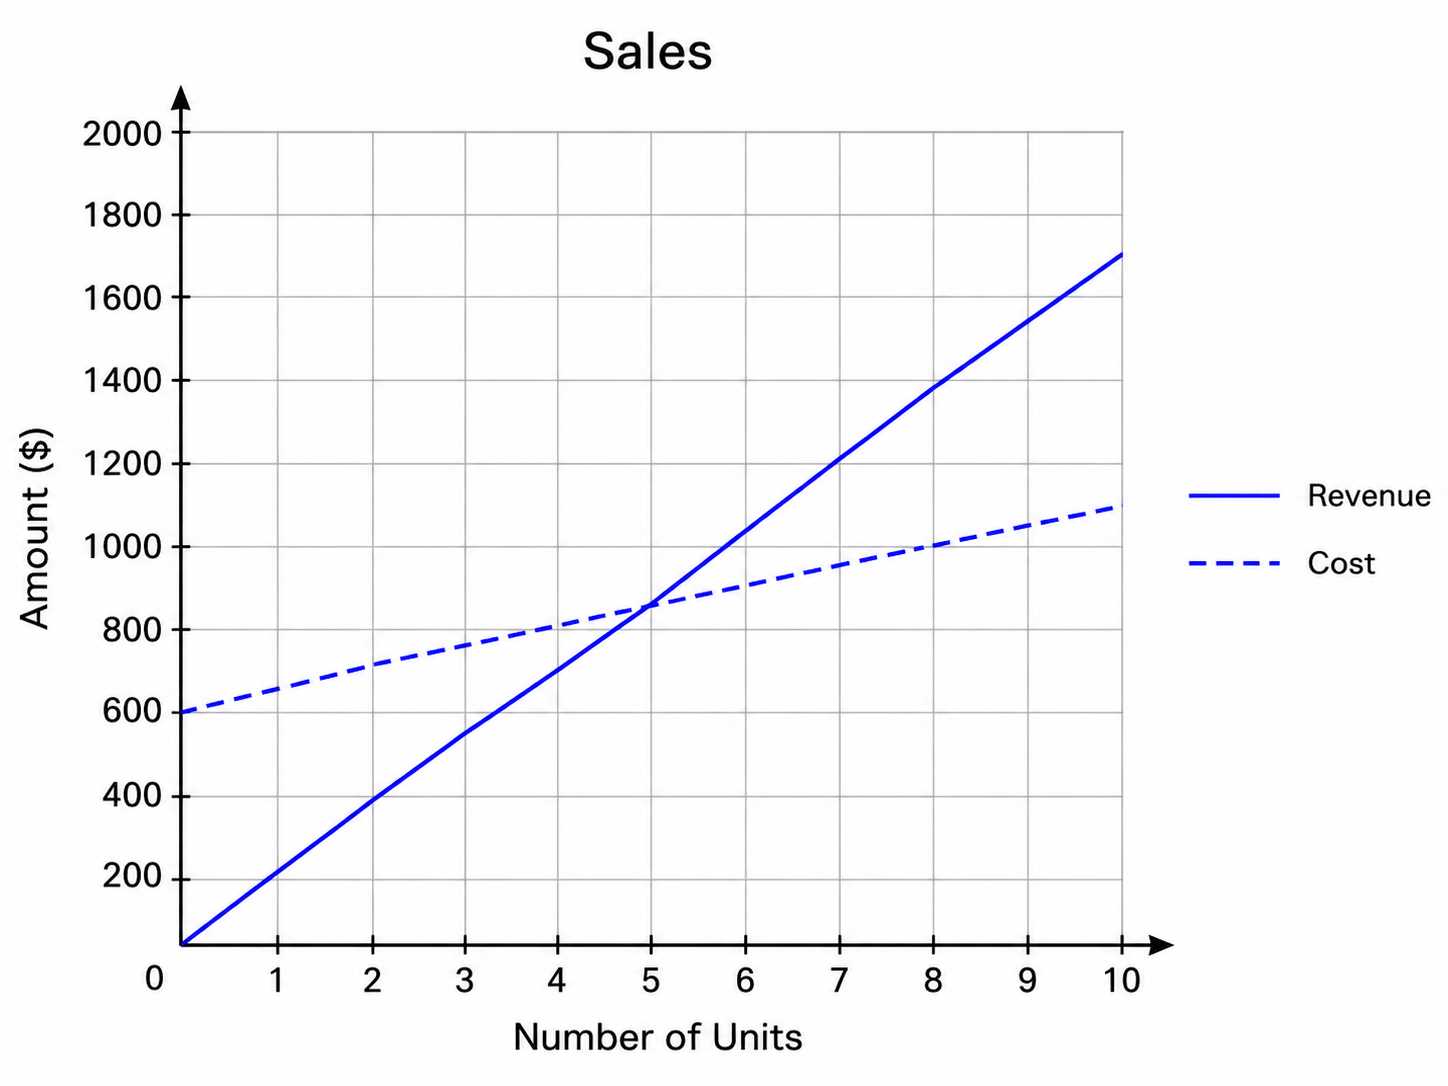
A person makes down quilts to sell.
The graph shows the functions that model the cost and revenue.
How many down quilts need to sell to break even/start making a profit?
The graph shows the functions that model the cost and revenue.
How many down quilts need to sell to break even/start making a profit?Options
Discussion
No comments yet. Be the first to comment.
Be respectful. No spam.
Question 1 of 20