.
Explanation:
To modify the bar chart to show the percentage of sales for each Subcategory within every Category,
you need to do the following steps:
Open the link to Book1 found on the desktop. This will open the Tableau workbook that contains the
CategoryPercentage worksheet.
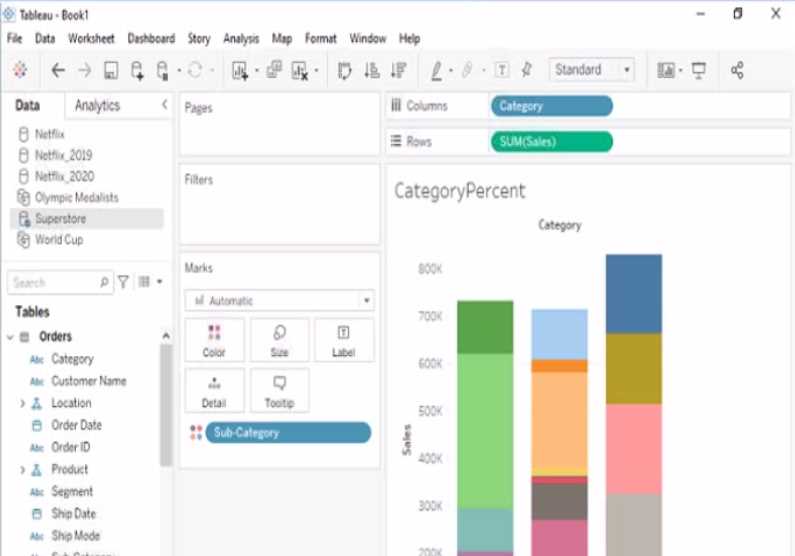
Click on the CategoryPercentage tab at the bottom of the workbook to open the worksheet. You will
see a bar chart that shows the total sales for each Subcategory across all Categories.
Right-click on Sales on the Columns shelf and select Add Table Calculation from the menu. This will
open a dialog box that allows you to apply a calculation to your measure.
Select Percent of Total from the Calculation Type drop-down list. This will calculate the percentage of
sales for each Subcategory out of the total sales for all Subcategories.
Select Category from the Compute Using drop-down list. This will calculate the percentage of sales
for each Subcategory within every Category, instead of across all Categories. The total percentage for
every Category will be 100%.
Click OK to apply the table calculation. You will see that the bar chart now shows the percentage of
sales for each Subcategory within every Category.
Reference: https://help.tableau.com/current/pro/desktop/en-us/calculations_tablecalculations.htm
https://help.tableau.com/current/pro/desktop/en-us/calculations_tablecalculations_create.htm
https://help.tableau.com/current/pro/desktop/enus/calculations_tablecalculations_percentoftotal.htm