
HOTSPOT You open powerbi.com as shown in the following exhibit. 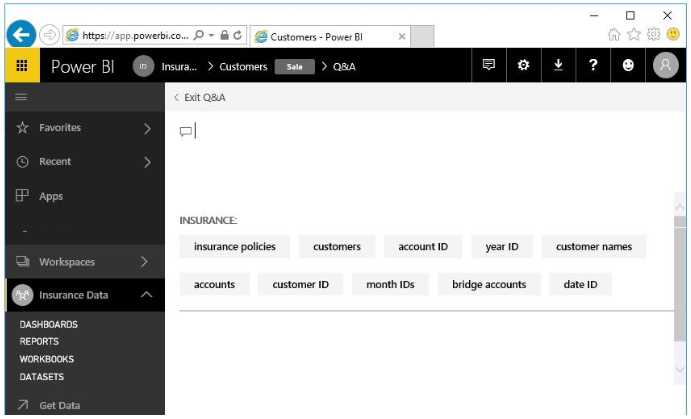 Use the drop-down menus to select the answer choice that completes each statement based on the information presented in the graphic. NOTE: Each correct selection is worth one point.
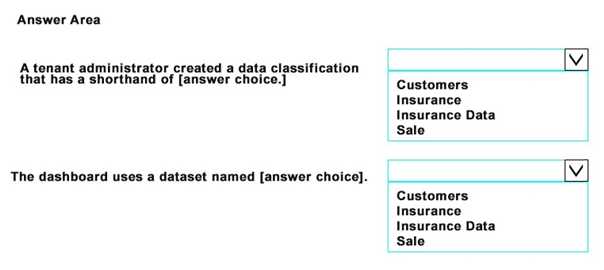
Looks like SALE is the label for the data classification, and INSURANCE is shown as the dataset in Q&A. The UI makes it pretty clear, unless they're being really sneaky. Anyone see a catch I'm missing?
I see the logic here. The first is SALE because that's the data classification tag shown by the dashboard name. INSURANCE pops up as the dataset name in the Q&A feature area. Unless they're twisting wording about which dataset powers visuals, this should be correct. Someone correct me if I missed a detail, but that's how I read the UI.
SALE and INSURANCE. Seen this setup in official guide practice and the classification tag is always up top by the report name, not above the Q&A fields. If you're prepping, screenshots like these in labs are super helpful for tricky UI questions.
