
DRAG DROP You have a Power Bl report that contains a table visual with a measure named Revenue. The Revenue measure returns values within a range of 0 to S. You need to formal the visual so that the Revenue column displays a specific background color based on the value range shown in the following table. 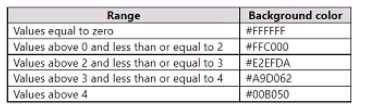 Which three actions should you perform in sequence in Power B) Desktop? To answer, move the appropriate actions from the list of actions to the answer area and arrange them in the correct order.
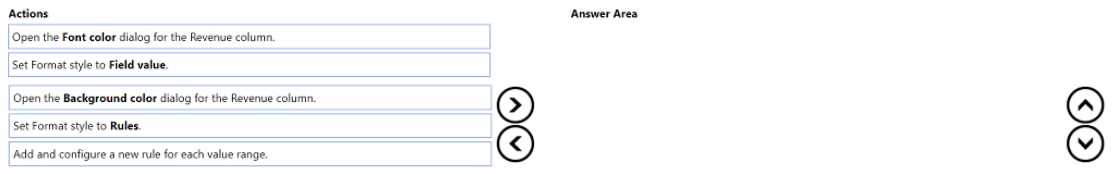
Yeah that's the right steps: open Background color dialog, set Format style to Rules, then add and configure rules for each range. Using Rules is key since you want color based on specific value bands. Pretty sure on this one but open to corrections.
I'm a bit skeptical about just sticking to background color if the requirement is about specific field-driven logic. I'd go with: Open the Background color dialog, set Format style to Field value, then add and configure a rule for each value range. "Field value" sometimes catches the conditional effect when using dynamic or calculated fields instead of fixed ranges. Not sure if this flips it, but that's what I've seen in similar builds. Disagree?
