
DRAG DROP You have a Power B1 semantic model that contains a table You need to create a Power B1 report page that contains two visuals that meet the following requirements: • Visual 1: Display* the distribution of hierarchical data • Visual 2: Search arid then filler by values Which type should you choose for each visual? To answer, drag the appropriate visual types to the correct visuals. Each visual type may be used once, more than once, or not at all. You may need to drag the split bar between panes or scroll to view content. NOTE: Each correct selection is worth one point. 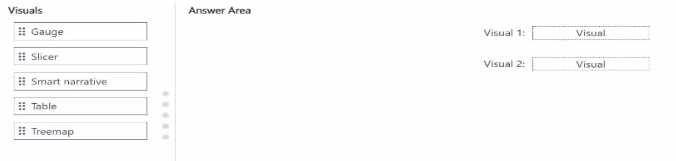
Pretty sure it's Treemap for Visual 1 (hierarchical data is its thing) and Slicer for Visual 2 (that's what lets you search and filter easily). Official guide covers these visual types if you want examples. Not 100 percent, but this matches most practice sets.
