
Q: 11
DRAG DROP You are modeling data in table named SalesDetail by using Microsoft Power Bl. You need to provide end users with access to the summary statistics about the SalesDetail dat a. The users require insights on the completeness of the data and the value distributions. Which three actions should you perform in sequence? To answer, move the appropriate actions from the list of actions to the answer area and arrange them in the correct order. 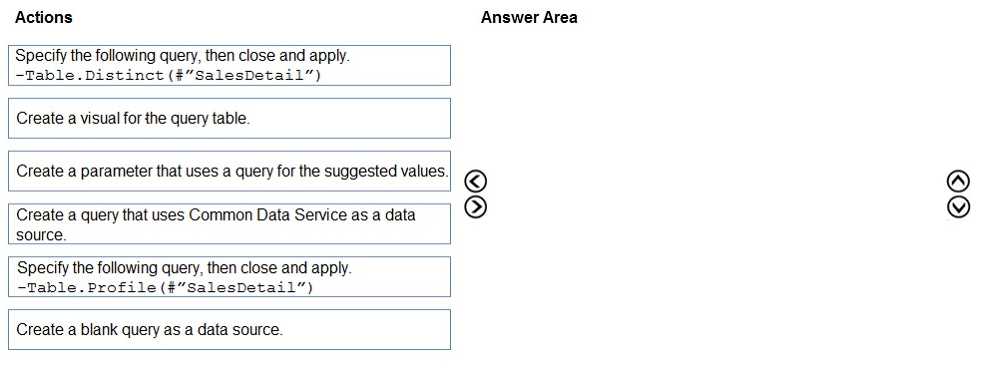
Drag & Drop
Discussion
Create a blank query, then use Table.Profile for profiling, finally build a visual. Pretty sure this order matches Power Query workflow.
Blank query, Table.Profile, then create a visual for the output. Distinct's a trap since they're asking for data completeness and distribution, not unique values. Pretty sure that's what similar exam questions want.
Create a blank query, Table.Profile, then create a visual. Distinct is a trap here, since they want stats not uniques.
Create a blank query > Table.Profile > create a visual. Any requirement to show distinct counts too, or only profile stats? Official guide and labs usually cover this task.
Create a blank query, Table.Profile, then create a visual for it. That's the sequence I saw in practice tests.
Be respectful. No spam.
