The diagnose command shown in the output is used to display information about NP6 packet
descriptor queues. The output shows that there are 16 NP6 units in total, and each unit has four XAUI
ports (XA0-XA3). The output also shows that there are some non-zero values in the columns PDQ
ACCU (packet descriptor queue accumulated counter) and PDQ DROP (packet descriptor queue drop
counter). These values indicate that there are some packet descriptor queues that have reached their
maximum capacity and have dropped some packets at the XAUI ports. This could be caused by
congestion or misconfiguration of the XAUI ports or the ISF (Internal Switch Fabric). Reference:
https://docs.fortinet.com/document/fortigate/7.0.0/cli-reference/19662/diagnose-np6-pdq
The output is showing a packet descriptor queue accumulated counter, which is a measure of the
number of packets that have been dropped by the NP6 due to congestion. The counter will increase
if there are more packets than the NP6 can handle, which can happen if the bandwidth between the
ISF and the NP is not sufficient or if the HPE shaper is enabled.
The output also shows that there are packet drops at the XAUI, which is the interface between the
NP6 and the FortiGate's backplane. This means that the NP6 is not able to keep up with the traffic
and is dropping packets.
The other statements are not true. Host-shortcut mode is not enabled, and enabling bandwidth
control between the ISF and the NP will not change the output. HPE shaper is a feature that can be
enabled to improve performance, but it will not change the output of the diagnose command.
Reference: https://docs.fortinet.com/document/fortigate/7.4.0/hardwareacceleration/48875/diagnose-npu-np6-dce-np6-id-number-of-dropped-np6-packets

 Given the information shown in the output, which two statements are true? (Choose two.)
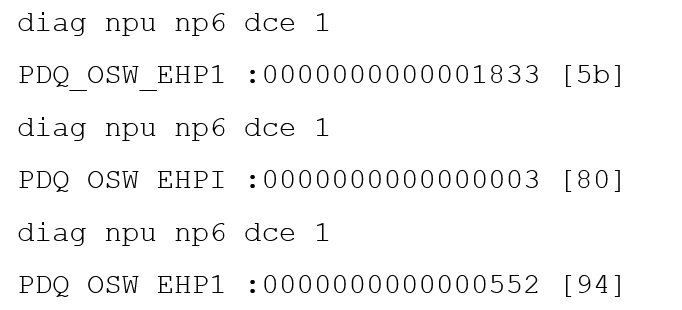 Given the information shown in the output, which two statements are true? (Choose two.)