
Q: 2
SIMULATION
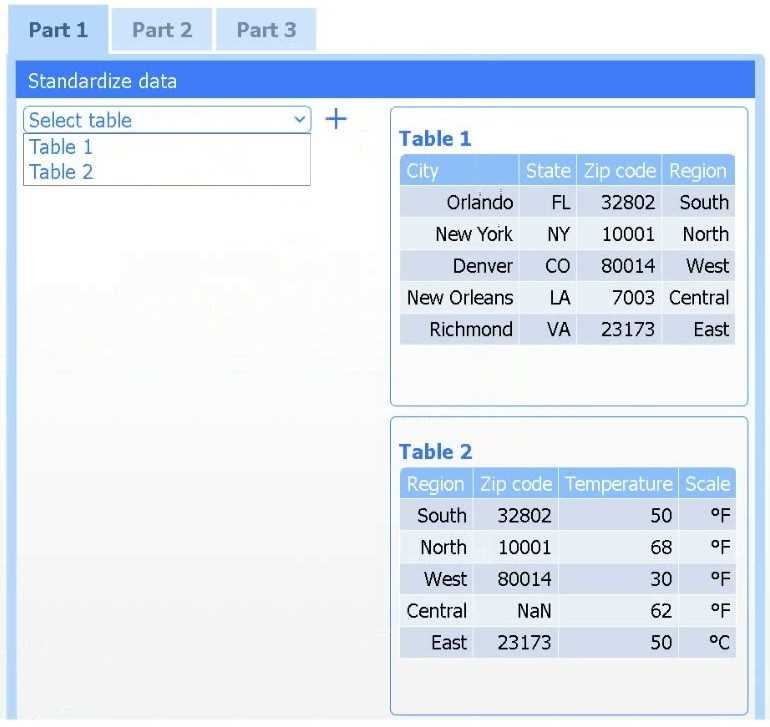
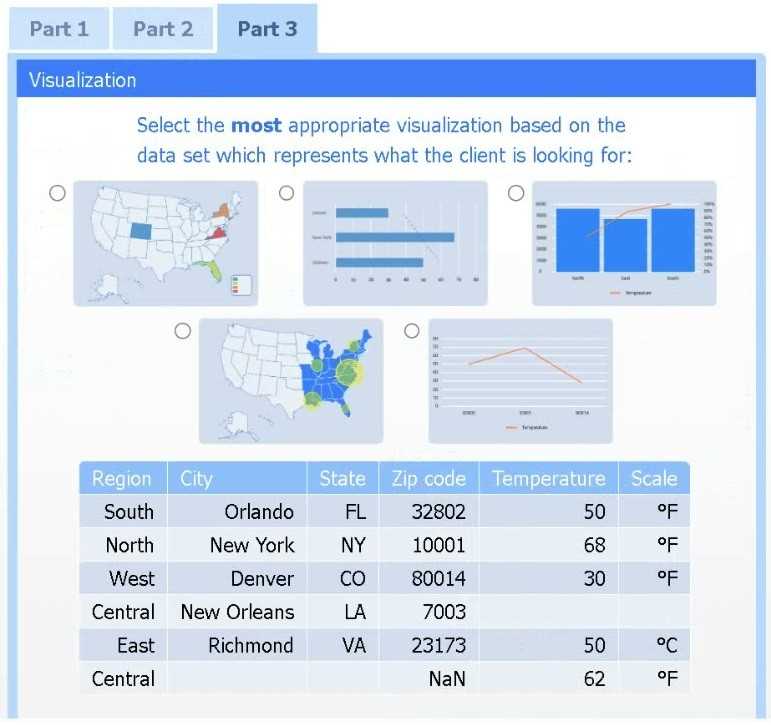
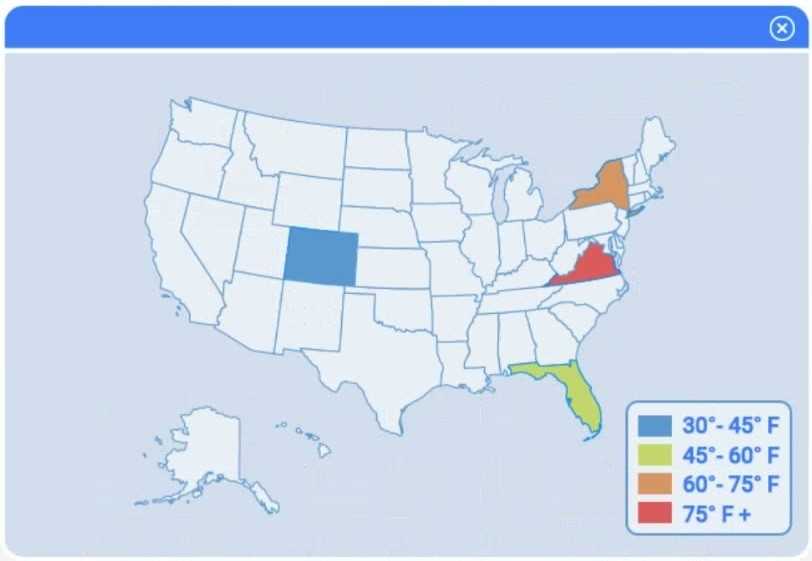
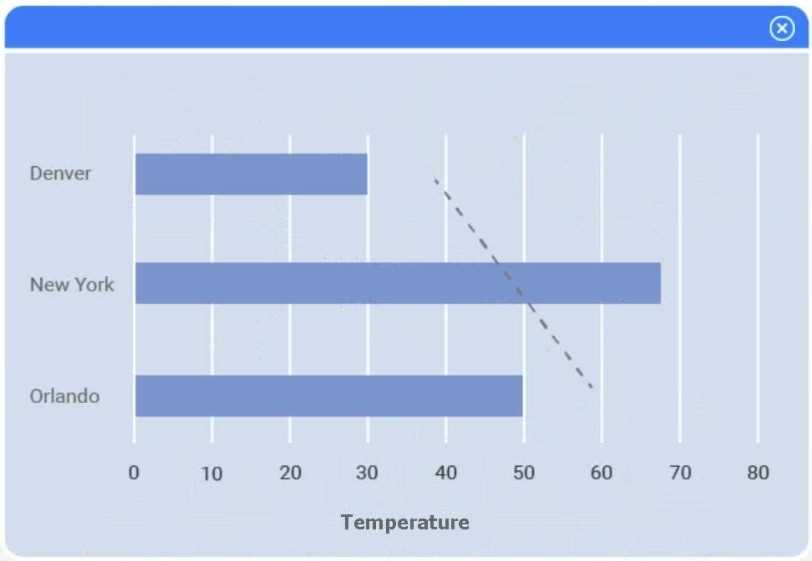
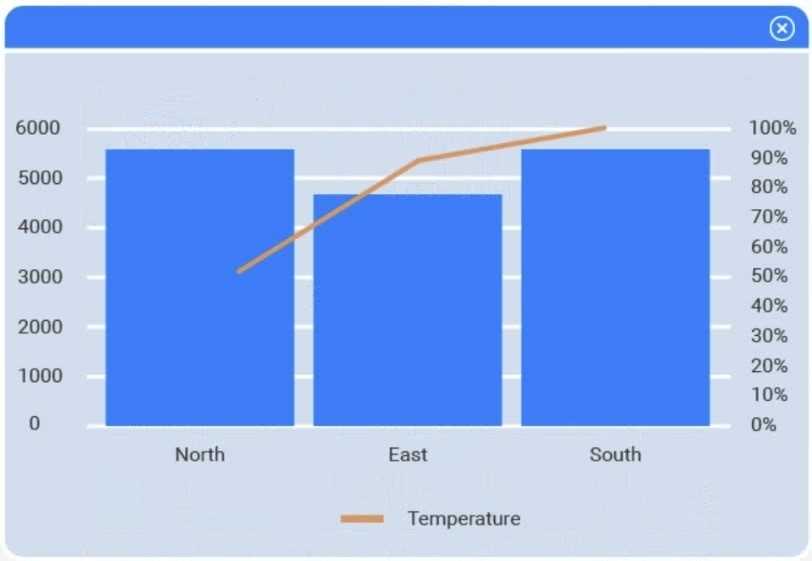
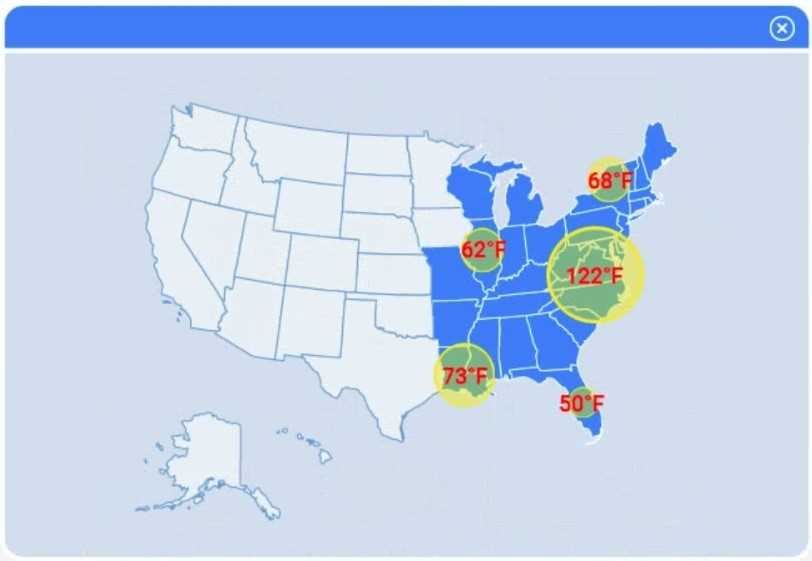
A client has gathered weather data on which regions have high temperatures. The client would like a visualization to gain a better understanding of the data.
INSTRUCTIONS
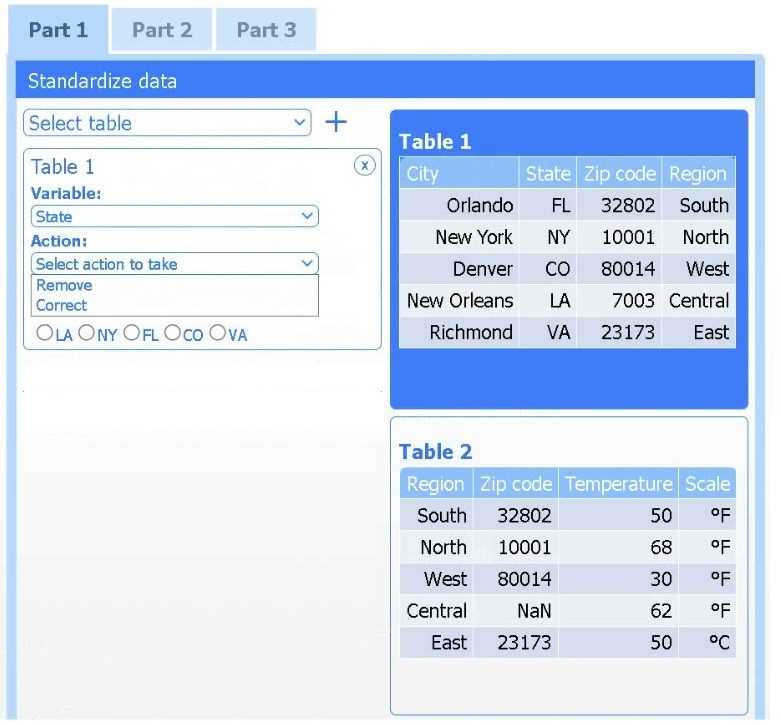
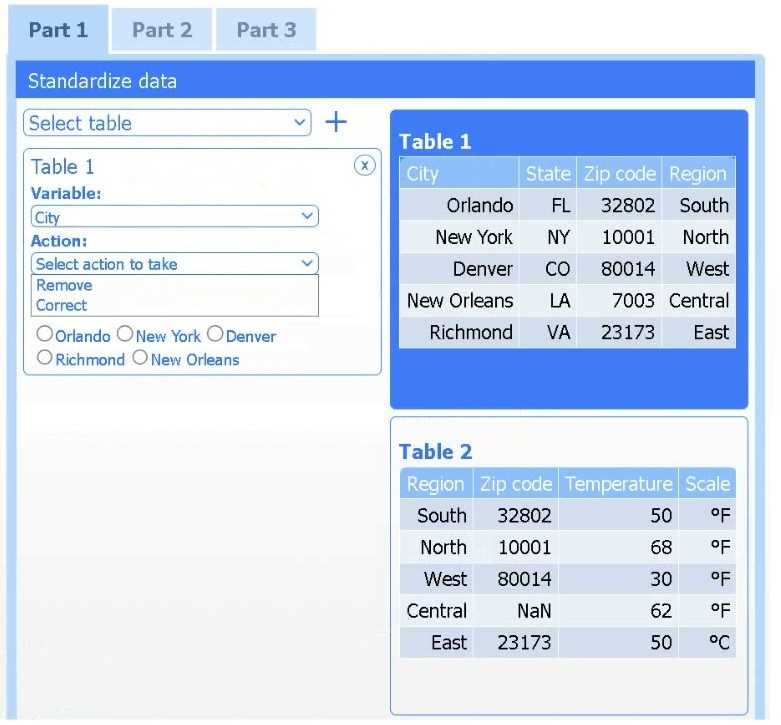
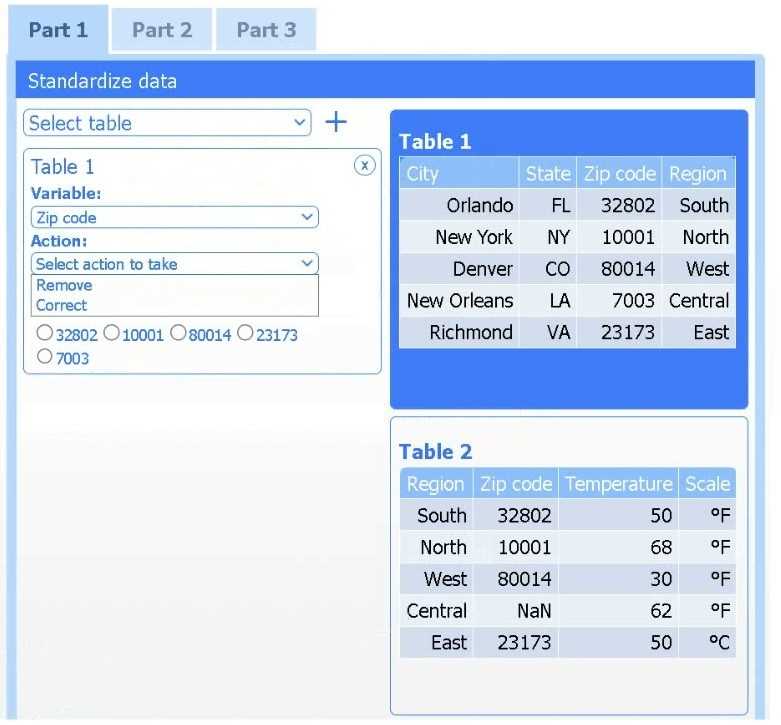
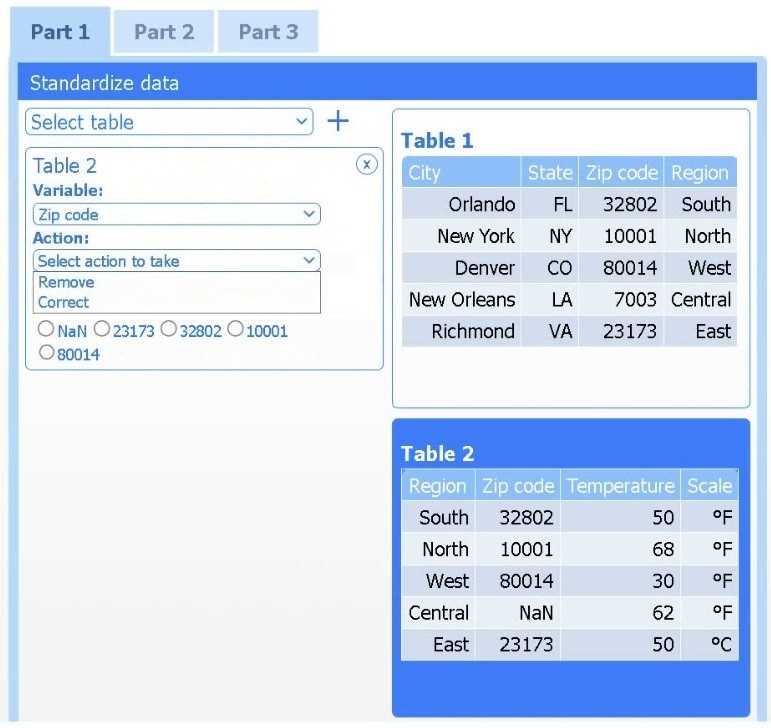
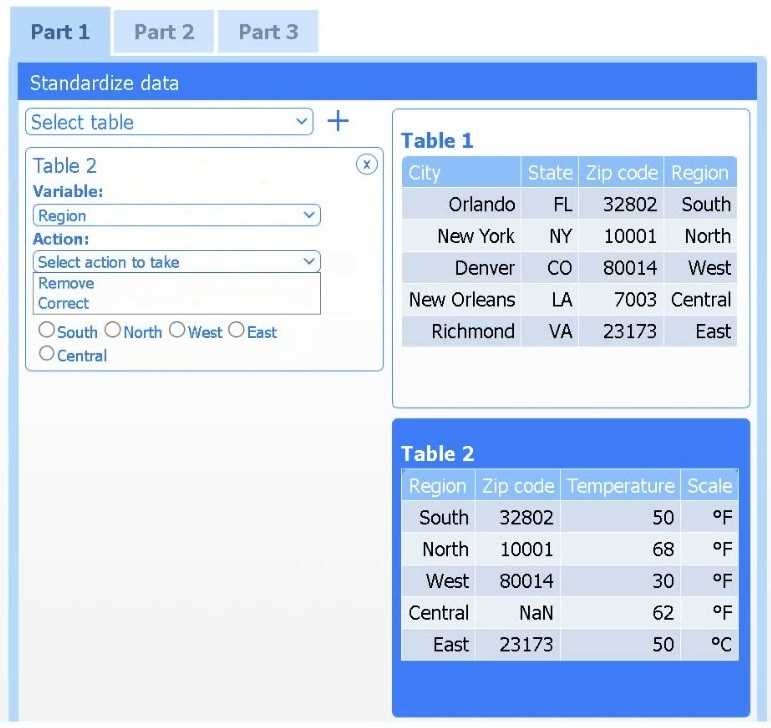
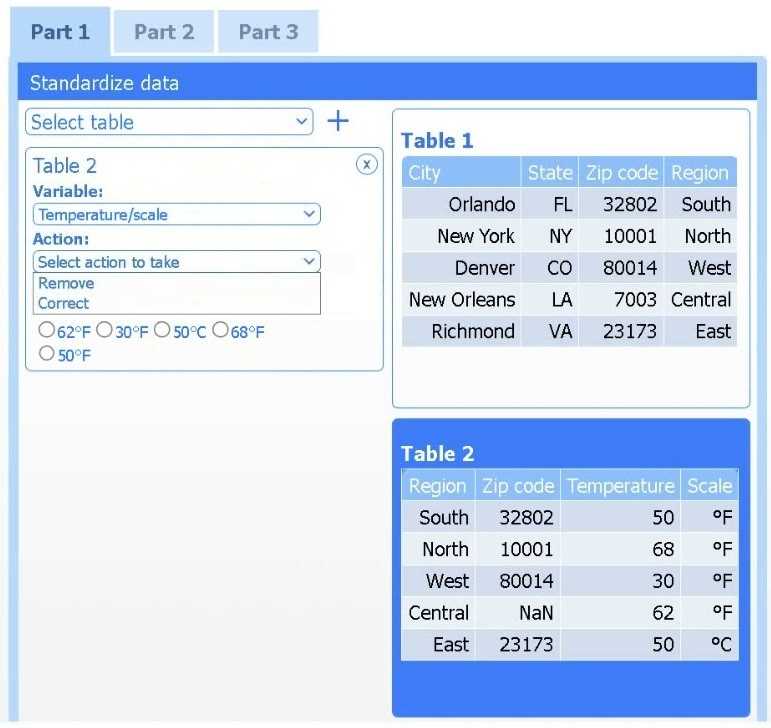
Part 1
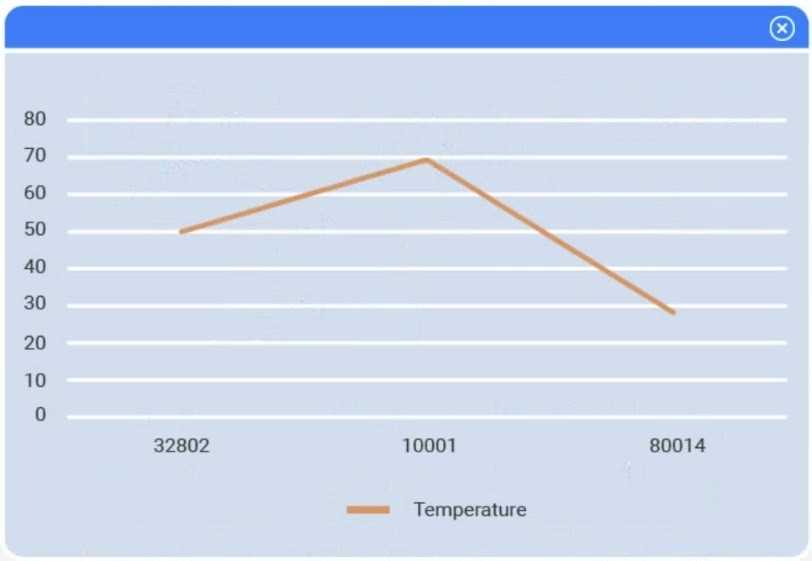
Review the charts provided and use the drop-down menu to select the most appropriate way to standardize the data.
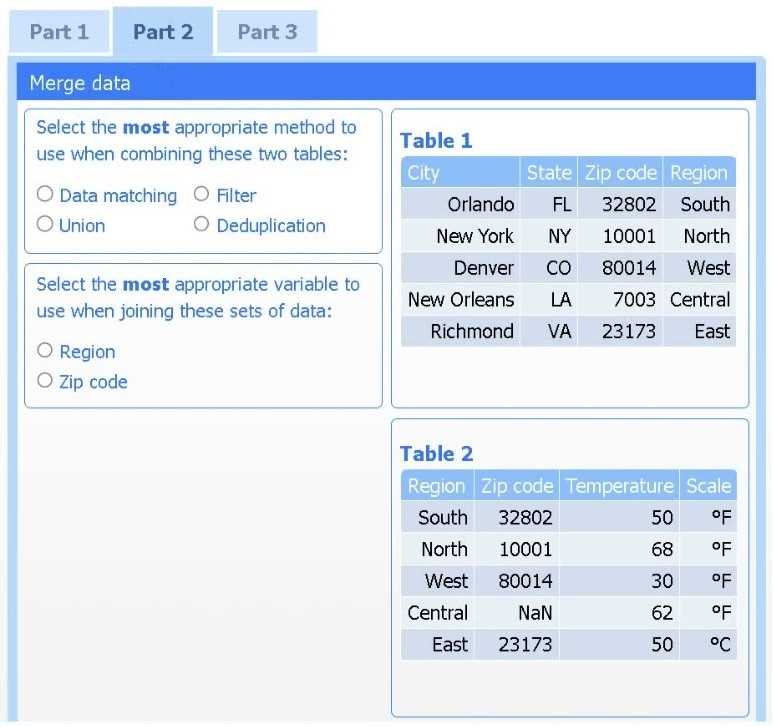
Part 2
Answer the questions to determine how to create one data set.
Part 3
Select the most appropriate visualization based on the data set that represents what the client is looking for.
If at any time you would like to bring back the initial state of the simulation, please click the Reset All button.


Your Answer
Discussion
No comments yet. Be the first to comment.
Be respectful. No spam.
