
Q: 1
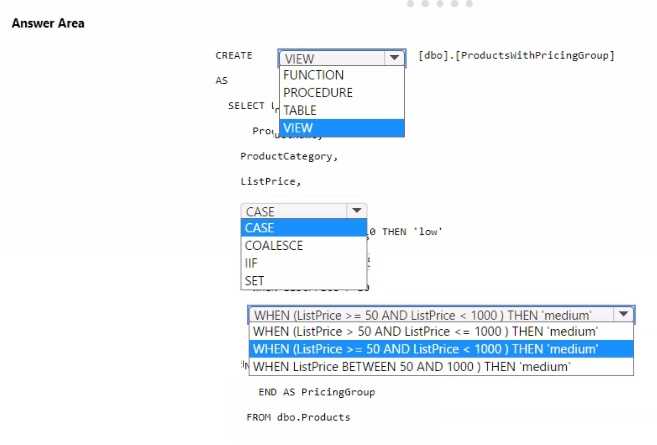
HOTSPOT You need to resolve the issue with the pricing group classification. How should you complete the T-SQL statement? To answer, select the appropriate options in the answer area. NOTE: Each correct selection is worth one point. 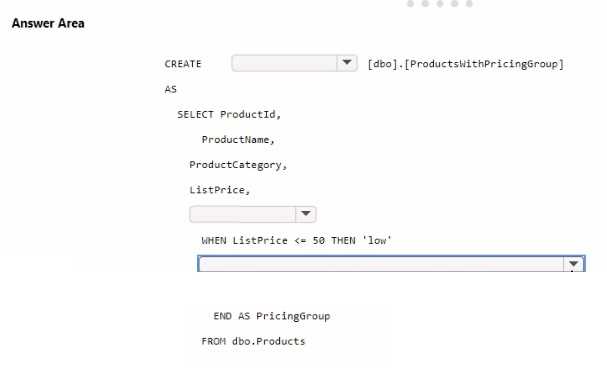
Your Answer
Discussion
C . You're just charting distributions and showing what the customer data looks like, not explaining why churn happened (B) or predicting future churn (D). Unless the question shifted to root causes or forecasting, it's strictly descriptive. Disagree?
B tbh, since comparing retained vs lost customers across segments feels like diagnostic analytics to me. You're looking for relationships or reasons behind churn, not just summarizing. I've seen similar wording confuse in practice tests, but could be off here.
Its C, not D. Just charting what happened so D (predictive) doesn’t fit here.
A is off here, it's C. Had something like this in a mock exam, and just visualizing groupings/characteristics is descriptive analytics. No forecasting or root cause, so not D or B.
Probably C since just visualizing who stayed or left is descriptive, not explaining why or suggesting actions.
Just summarizing past churn data in charts means it's descriptive analytics (C), not diagnostic. No analysis of why customers left, only what the distributions are. Pretty sure that's what Microsoft expects here, but happy to hear other takes.
C not B. The question only mentions visualizing past churn, no root cause analysis or prediction so diagnostic is tricky.
Probably C. D is a trap since nothing in the scenario talks about prediction or forecasting.
C for sure since they're mainly displaying and summarizing existing data in those charts. No signs of prediction (which would be D) or root cause analysis (B). Showing distributions across customer groups is classic descriptive analytics. Pretty typical scenario from training labs, but let me know if I'm missing something.
Definitely C. The scenario is just showing distributions from historical data, not trying to predict churn or give reasons why.
Be respectful. No spam.
