
Q: 20
SCENARIO
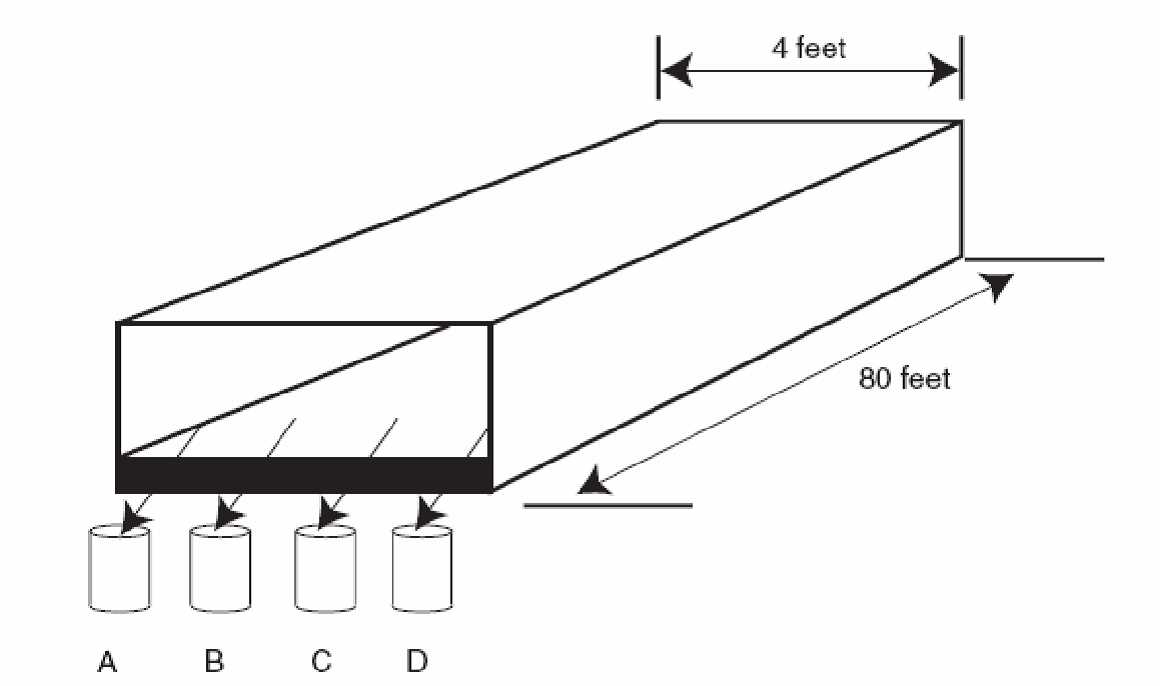
A Six Sigma team is measuring the moisture content of corn starch as it leaves the conveyer belt of a
dryer. They collect one sample four cups of starch at times indicated in the chart at fixed locations
labeled A, B, C, and D across the end of the belt. See the diagram below.
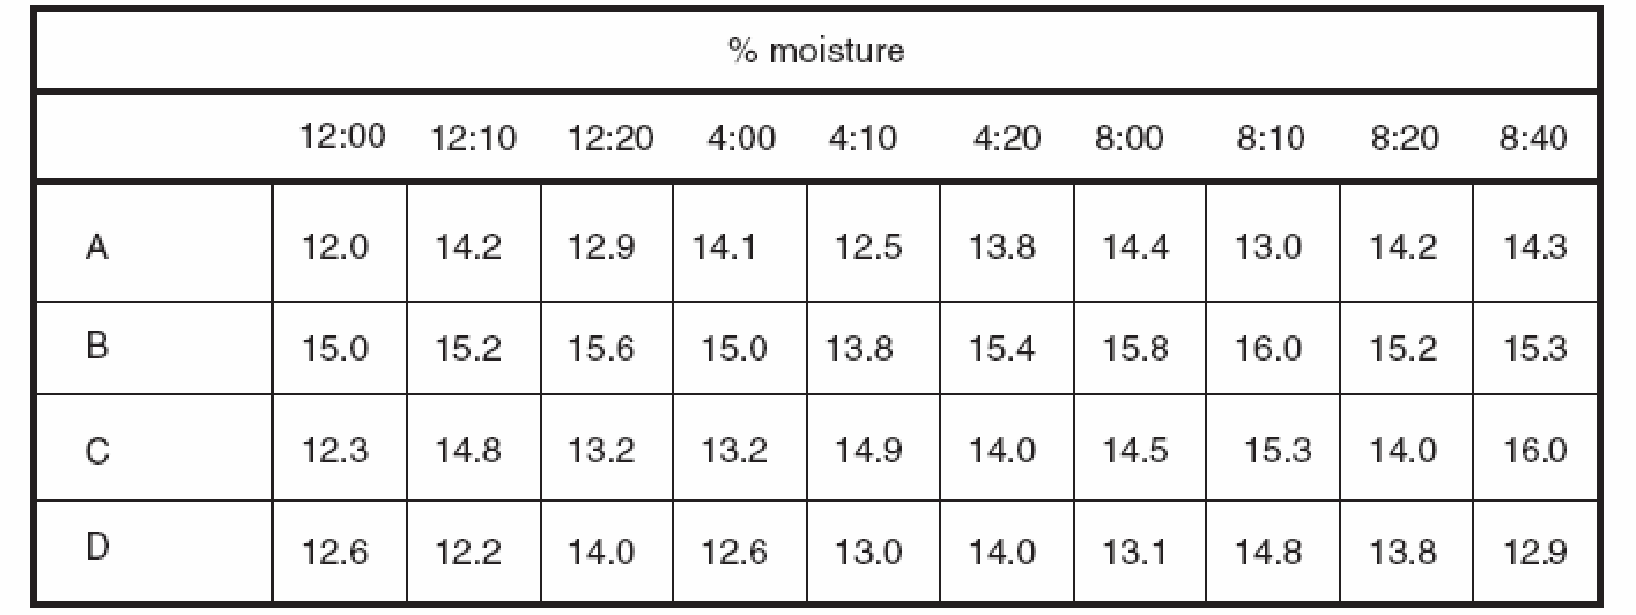
 The data for a nine hour period are:
Which type of variation dominates? (Hint: Plot the points on the graph above.)
The data for a nine hour period are:
Which type of variation dominates? (Hint: Plot the points on the graph above.)
 The data for a nine hour period are:
 Which type of variation dominates? (Hint: Plot the points on the graph above.)
Options
Discussion
No comments yet. Be the first to comment.
Be respectful. No spam.
