Tableau (Salesforce) Official Documentation. Tableau Desktop and Web Authoring Help. "Add a secondary table calculation".
Reference: This document explicitly details the procedure for applying a secondary calculation to a measure that already has a primary table calculation. It states, "You can add a secondary table calculation to a measure that already has a table calculation applied to it... For example, you can apply a primary table calculation to calculate the yearly running total of sales, and then apply a secondary table calculation to calculate the year-over-year percent difference."
Tableau (Salesforce) Official Documentation. Tableau Desktop and Web Authoring Help. "Table Calculation Types".
Reference: Section: Percent Difference From. This reference confirms that Percent Difference From is the correct calculation type for this scenario, as it "computes the percent difference from the previous value in the partition."
Tableau (Salesforce) Official Documentation. Tableau Desktop and Web Authoring Help. "Transform Values with Table Calculations".
Reference: Section: Compute Using. This guide explains the necessity of using Specific Dimensions to control the scope and direction of the calculation. For the primary calculation, the scope is Segment; for the secondary, the scope is YEAR(Order Date).
MIT Libraries. Data Management and Visualization Guide. "Tableau: Table Calculations".
Reference: This university courseware guide confirms the nature of table calculations, stating they "are computed based on what is currently in the visualization" and can be used for "percent of total... [and] percent difference". It reinforces the use of these functions on the data present in the crosstab.

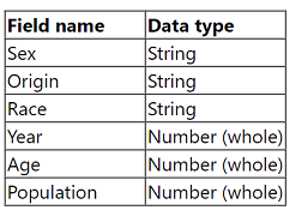 Open the Population worksheet. Enter the total number of records contained in the data set into the Total Records parameter. From the File menu in Tableau Desktop, click Save.
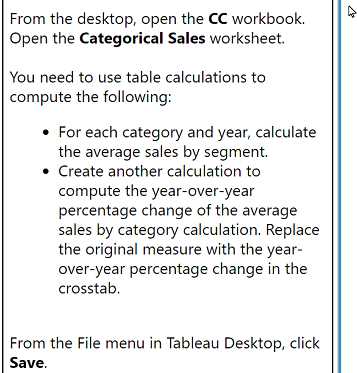 From the desktop, open the CC workbook. Open the Categorical Sales worksheet. You need to use table calculations to compute the following: . For each category and year, calculate the average sales by segment. . Create another calculation to compute the year-over-year percentage change of the average sales by category calculation. Replace the original measure with the year- over-year percentage change in the crosstab. From the File menu in Tableau Desktop, click Save.
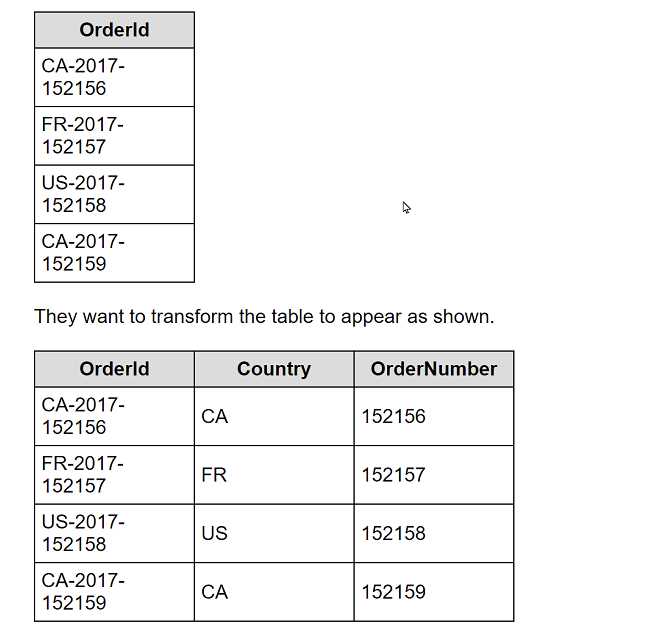 What should the consultant use to transform the table in the most efficient manner?