
SIMULATION Refer to the exhibit. 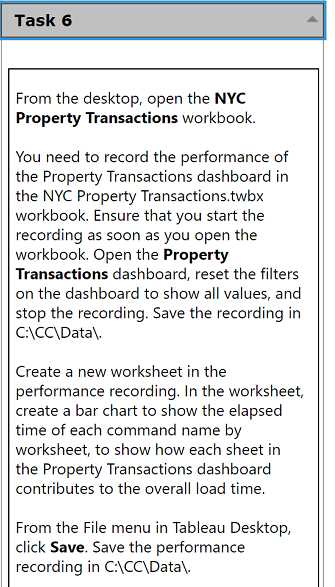 From the desktop, open the NYC Property Transactions workbook. You need to record the performance of the Property Transactions dashboard in the NYC Property Transactions.twbx workbook. Ensure that you start the recording as soon as you open the workbook. Open the Property Transactions dashboard, reset the filters on the dashboard to show all values, and stop the recording. Save the recording in C:\CC\Data\. Create a new worksheet in the performance recording. In the worksheet, create a bar chart to show the elapsed time of each command name by worksheet, to show how each sheet in the Property Transactions dashboard contributes to the overall load time. From the File menu in Tableau Desktop, click Save. Save the performance recording in C:\CC\Data\.
Q: 9
Your Answer
Discussion
No comments yet. Be the first to comment.
Be respectful. No spam.
Question 9 of 15
