
Q: 5
HOTSPOT Select the answer that correctly completes the sentence. 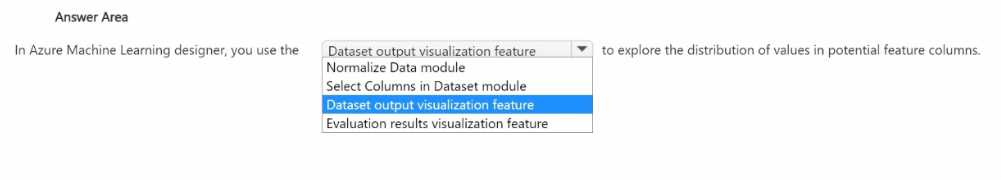
Your Answer
Discussion
Yep, for showing distributions and stats in the designer, it's Dataset output visualization feature. You right-click the dataset and pick Visualize to see all those summary details. Normalize Data would just change values but not actually show you distributions. I think this is solid, but let me know if anyone's seen different wording elsewhere.
Saw similar on a practice test, official guide says Dataset output visualization feature.
Nah, Normalize Data is just for changing the values. Dataset output visualization feature is the one actually showing column distributions.
Nah, not Normalize Data-it's DATASET OUTPUT VISUALIZATION FEATURE.
Yep, it's DATASET OUTPUT VISUALIZATION FEATURE.
Ugh, Microsoft always buries this in their UI.
DATASET OUTPUT VISUALIZATION FEATURE
Dataset output visualization feature
This one specifically lets you right-click and see histograms, counts, unique values etc for each column in the dataset. Normalize Data doesn't show those stats, it just changes the data. Pretty sure this is what they're after here.
This one specifically lets you right-click and see histograms, counts, unique values etc for each column in the dataset. Normalize Data doesn't show those stats, it just changes the data. Pretty sure this is what they're after here.
DATASET OUTPUT VISUALIZATION FEATURE
So do you think Normalize Data ever shows the actual column stats or distributions, or is it only for changing the values?
Dataset output visualization feature, saw a similar one on a practice set and it’s all about viewing column stats, not modifying anything.
Be respectful. No spam.
