An analyst for a movie producer is making an Explore query to show total box office revenue by
movie. The initial query has three dimensions:
Ticket Purchase Month
Movie Name
Ticket Revenue
The analyst notices that the numbers look a lot smaller than expected and the results are difficult to
understand.
What should the analyst do to make the Explore query show the desired metric?
Options
Discussion
No comments yet. Be the first to comment.
Be respectful. No spam.
Correct Answer:
C
Explanation
:
Q: 2
An executive needs to receive a dashboard every morning with data for the previous day only. The
dashboard currently has a date filter defined. The executive must receive only the data requested,
and the dashboard data needs to remain unchanged for all other users.
What should the analyst do to meet this requirement?
Options
Discussion
No comments yet. Be the first to comment.
Be respectful. No spam.
Correct Answer:
B
Explanation
:
Q: 3
A CEO wants to receive a daily email with the existing executive dashboard to review on a mobile
device on the way to the office.
What should the analyst do to optimize the dashboard for mobile viewing?
Options
Discussion
No comments yet. Be the first to comment.
Be respectful. No spam.
Correct Answer:
B
Explanation
:
Q: 4
An analyst creates a dashboard that shows sales at an aggregate and then an individual level. This
dashboard is slow to run, and the analyst sees a warning about how load times may be impacted in
dashboards with more than 25 tiles.
What should the analyst create to make sure all data sources in this dashboard are connected but still
load quickly?
Options
Discussion
No comments yet. Be the first to comment.
Be respectful. No spam.
Correct Answer:
A
Explanation
:
Q: 5
Users find it difficult to distinguish the dashboards they need for tracking sales performance. There
are more than 30 operation-related dashboards in the same folder.
What should the analyst do to improve the navigation experience?
Options
Discussion
No comments yet. Be the first to comment.
Be respectful. No spam.
Correct Answer:
C
Explanation
:
Q: 6
An analyst works on the data team at an organization that maintains multiple similar Explores. The
analyst has access to see every Explore, but knows that employees in the finance department only
have access to explores tagged Finance.
There is an Employee Compensation Data Finance Explore that the finance department has access to.
The analyst usually uses an All Employee Data Explore that also includes personally identifiable
information.
What should the analyst do to ensure proper access if the analyst wants to send an example
visualization to the finance team?
Options
Discussion
No comments yet. Be the first to comment.
Be respectful. No spam.
Correct Answer:
B
Explanation
:
Q: 7
An analyst needs to filter the sum of the sales between 12 complete months ago to the last 9
complete months ago.
How can the analyst create this filter condition?
Options
Discussion
No comments yet. Be the first to comment.
Be respectful. No spam.
Correct Answer:
A
Explanation
:
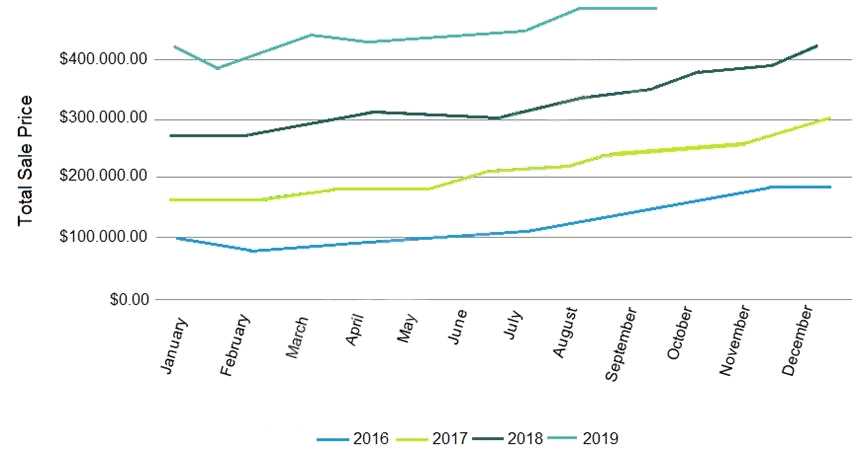
Q: 8
An analyst needs to compare monthly sales, year over year, based on when an order was created, as
shown in the exhibit.
How should the analyst, in addition to selecting the measure Total Sales build the report?
Options
Discussion
No comments yet. Be the first to comment.
Be respectful. No spam.
Correct Answer:
A
Explanation
:
Q: 9
An analyst has a dashboard with a single filter on Created Date “is in the past year”, but a tile on the
dashboard is returning results for only the past 7 days. When the analyst selects “Explore from Here”
on the tile, there are filters on both Created Date “is in the past year” and Created Time “is in the
past 7 days”.
How should the analyst make sure that only the filter set on the dashboard is applied to the tile?
Options
Discussion
No comments yet. Be the first to comment.
Be respectful. No spam.
Correct Answer:
D
Explanation
:
Q: 10
An analyst adds a Day dimension and a Signup Count measure to an Explore to show the number of
new users added per day. The analyst wants to add a metric that increases by the number of new
users per day, on a rolling basis.
How should that metric be calculated?

 How should the analyst, in addition to selecting the measure Total Sales build the report?